Figures & data
TABLE 1 Summary of 13 connexin and 2 pannexin genes expressed in the zebrafish retina
TABLE 2 Chromosomal localization of retinal connexin and pannexin genes and summary of PCR products generated by RT-PCR or real-time RT-PCR
Figure 1 Tissue-specific expression of retinal connexins. QRT-PCR analysis of 9 connexins showed expression in the retina, whereas expression in the other organs varied. The brain was defined as reference condition and all other tissues as conditions I to VI. All cDNA preparations were assessed by PCR using primers specific for 16s rRNA. This analysis confirmed that comparative amounts of cDNA were included in all PCR reactions. No template controls were negative and a second PCR control reaction (with 16s rRNA primers or specific primers) omitting reverse transcription produced no amplification products, indicating the absence of genomic DNA contamination in the mRNA samples (data not shown). Ct values (retina) were in the range of 27.8 (drCx35.1) to 37.6 (drCx39.9), with a mean Ct value of 15.3 for 16s rRNA. Values are expressed on a 2-log scale. Error bars represent 2-log standard errors.
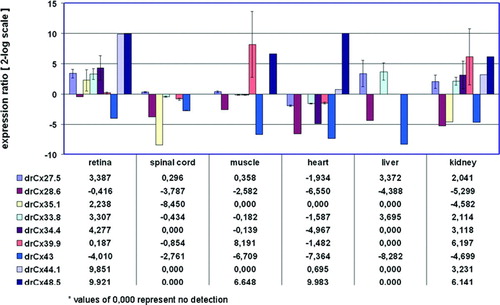
Figure 2 Relationship of the human Cx59/Cx62 with zebrafish connexins. (A) The amino acid alignment was created using the Clustal W algorithm (Thompson et al. Citation1994) and the BLOSUM62mt2 matrix. The color code for identical amino acids, conservative amino acid exchanges, or blocks of similar amino acids are indicated. The position of the four transmembrane domains TM1 to TM4 were calculated using drCx52.6 as reference and the TMpred program implemented on the ExPasy.ch homepage. The conserved cysteine motifs in the extracellular loops EL1 and EL2 are marked by arrows. (B) A guide tree, resembling a phylogenetic tree, was built using the neighbor-joining method (NJ) (Battilana et al. Citation2002). The NJ method works on a matrix of distances between all pairs of sequence to be analyzed. These distances are related to the degree of divergence between the sequences. The guide tree is calculated after the sequences were aligned (see above). The values displayed in parenthesis following the molecule name displayed on the tree are the amino acids identity scores calculated by AlignX (VectorNTI).
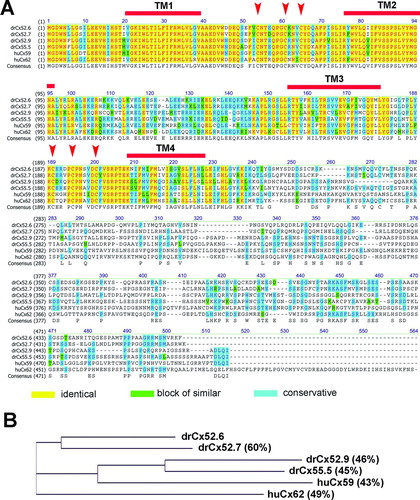
Figure 3 Relative expression ratio plot of Cx59/Cx62 related connexins in adult zebrafish tissues. The relative expression was calculated after real-time RT-PCR using the REST-MCS software based on the original concept introduced by Pfaffl et al. (Citation2002a). The retina was defined as reference condition and all other tissues as conditions I to VI. Crossing point values obtained for the 16s rRNA gene served as internal standards and all other genes as target genes 1 to 4. Ct values (retina) were in the range of 29.7 (drCx55.5) to 34.5 (drCx52.7). Values are expressed on a 2-log scale. Error bars represent 2-log standard errors.
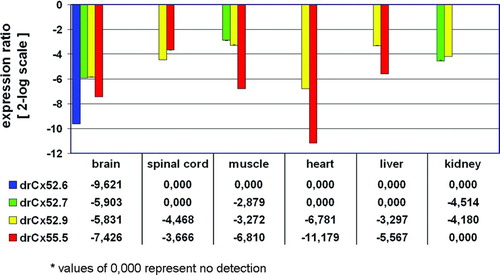
Figure 4 Schematic representation of the exon organization of the drPanx2 isoforms. The localization of drPanx2-IsoA,-IsoB and-IsoC exons was drawn relative to the sequence of the bacterial artificial chromosome (BAC) clone BX957245. The positions of individual exons were identified by alignment of Panx2 sequences with the BAC clone using by AlignX (VectorNTI). Note that the size of individual clones is not drawn to scale.
TABLE 3 Exon organization of the three drPanx2 transcript isoforms expressed in the retina and brain of the adult zebrafish
Figure 5 Relationship of the human Panx2 with three zebrafish Panx2 transcript isoforms. The amino acid alignment was created using the Clustal W algorithm and the BLOSUM62mt2 matrix as described above. The color code for identical amino acids, conservative amino acid exchanges, or blocks of similar amino acids is indicated. The position of the four transmembrane domains TM1 to TM4 is indicated. The conserved cysteines in the extracellular loops EL1 and EL2 are marked by red arrows. Note the position of the second cysteine in EL2 (black arrow), which is replaced by a serine motif in all three transcript isoforms. The expansion of the amino terminal domain (11 amino acids) is highlighted.
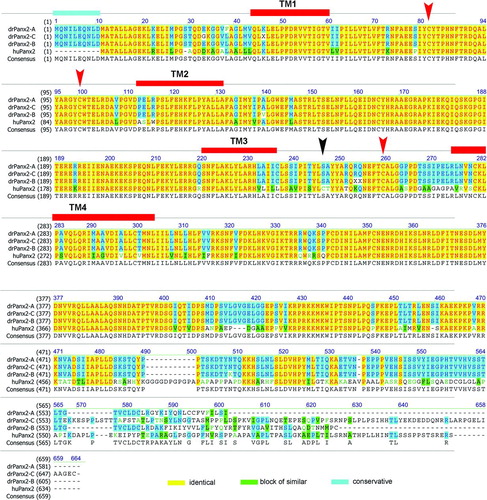
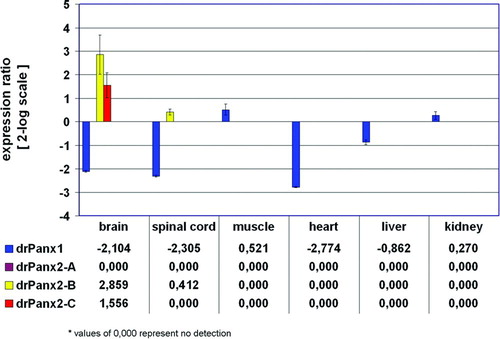
Figure 6 Relative expression ratio plot of pannexin expression in adult zebrafish tissues. The relative expression of pannexins was calculated after real-ime RT-PCR using the REST-MCS software based on the original concept introduced by Pfaffl et al. (Citation2002a). The retina was defined as reference condition and all other tissues as conditions I to VI. Crossing point values obtained for the 16s rRNA gene served as internal standards and all other genes as target genes 1 to 4. Ct values (retina) were in the range of 28.8 (drPanx2-IsoC) to 33.5 (drPanx2-IsoB). Values are expressed on a 2-log scale. Error bars represent 2-log standard errors.