Figures & data
Figure S1 The “multiple yellow” experimental design of the microarray experiment. WT = wild-type (untreated) astrocytes; KO = Cx43 null astrocytes; SI = Cx43 siRNA-treated WT astrocytes; KO/WT, SI/WT = expression ratio when comparing the indicated types of astrocytes, with green and red background indicating the labeled samples that were compared and the yellow background indicating the average of the two comparisons; REV = analysis of relative expression variability; COORD = coordination analysis, both within biological replicas.
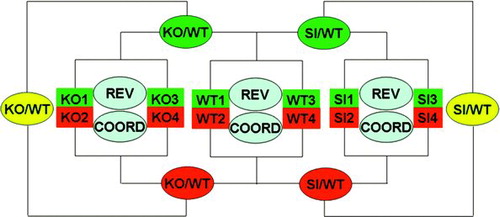
Figure 1 Efficiency of Cx43 siRNA treatment. (A) Western blot showing expression level of Cx43 in untreated and siRNA-treated cultured astrocytes. (B) Bar histogram showing the relative expression level of Cx43 in untreated and Cx43 siRNA-treated astrocytes with respect to control astrocytes.
Figure 2 (A) Chromosomal distribution of the regulated genes. Column height is proportional to the percent regulated of quantified unigenes in each (1, …, 19, X, U = unknown) chromosome (negative for down-regulation) in the indicated sample with respect to WT astrocytes. Note the lack of positional dependence of the regulated genes in both Cx43 knockout and knockdown astrocytes. (B) Percentages of genes regulated in KO that were similarly (SIM) or oppositely (OPP) regulated in SI. Note that the number of similarly regulated genes (SIM) exceeded significantly that of oppositely regulated (OPP) genes for all chromosomes except chromosome 12.
TABLE 1 Examples of GO categogries (biological processes, molecular functions, and cellular locations) that were similarly regulated in KO and SI astrocytes with respect to WT
Figure 3 Overlap of expression regulation. (A) Venn diagrams showing the number of down-and up-regulated genes in KO and SI, as well as the number of genes that were similarly regulated in both conditions. (B) Log-log plot of the expression ratios obtained in Cx43 siRNA-treated astrocytes (SI) against expression ratios obtained in Cx43 KO astrocytes (KO); both ratios were computed with respect to that of wild-type astrocytes (WT). Note the significant non-zero slope of the linear regression, indicating significant (p < 0.0001) positive correlation between the two sets of expression ratios. (C) Expected (gray bars) and observed (white bars) numbers of similarly and oppositely regulated genes. First D/U indicates down/up-regulation in KO (first letter) or SI (second) astrocytes. Note the significant difference between the predicted and observed numbers of regulated genes in each class, indicating that similarity between the two treatments are not due to chance.
Figure 4 Overlap of expression variability regulation and changes in transcription control priorities. (A) Box charts of relative expression variability (REV) of genes within the three types of astrocytes. Note the p values of the hypothesis regarding the equality of the indicated rev averages. (B) Linear regression of the changes in hierarchy of transcription control in KO and SI with respect to WT astrocytes. Note the significant non-zero slope.
Figure 5 Remodeling of gene interlinkages. Note the lack of interlinkage between the genes in WT genotype and their presence in SI and KO. Of note is the similar remodeling of gene interlinkages within the polymerase III cluster induced by knockdown and knockout. Red lines indicate significant synergistic expression of the connected genes and blue lines indicate antagonistic expression. Genes: Brf1 = BRF1 homolog, subunit of RNA polymerase III transcription initiation factor IIIB (S. cervisiae); Brf2 = BRF2, subunit of RNA polymerase III transcription initiation factor, BRF1-like; Gcn512 = GCN5 general control of amino acid synthesis-like 2 (yeast); Mycbp = c-myc–binding protein; Polr3b = polymerase (RNA) III (DNA directed) polypeptide B; Polr3c = polymerase (RNA) III (DNA directed) polypeptide C; Polr3e = polymerase (RNA) III (DNA directed) polypeptide E; Polr3f = polymerase (RNA) III (DNA directed) polypeptide F; Polr3gl = polymerase (RNA) III (DNA directed) polypeptide G like; Polr3K = polymerase (RNA) III (DNA directed) polypeptide K; Trrap = transformation/transcription domain-associated protein.
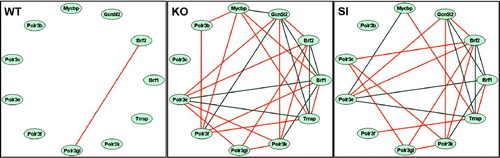
Figure 6 Overlap of coordination profiles. Plots of correlation coefficients between the expression levels of the indicated genes with each other genes within the biological samples of the indicated samples (WT, KO, and SI). Note the striking similarity of the coordination profile of Polr3k with that of Brf2 and the striking opposition with Brf1 in both Cx43 null (KO) and Cx43siRNA (SI) astrocytes and the differences with regard to wildtype (WT) astrocytes.