Figures & data
Figure 1 Secondary structural analysis of the Cx40CT domain. (A) Analysis of the chemical shift deviations from random coil for α-and β-carbon chemical shift. All residues located immediately N-terminal to a proline residue, except Q320, had α-carbon chemical shift values shifted approximately −2 ppm. (B) Backbone NOEs used in the structural analysis.
Figure 2 1H15N-HSQCs of the Cx40 carboxyl terminus (Cx40CT) in the presence of the PDZ-2 domain of ZO-1. This experiment allowed for detection of the regions of Cx40CT that were structurally modified when in the presence of a binding domain from the molecular partner ZO-1. (A) Cx40CT was titrated with the PDZ-2 domain of ZO-1 to a 1:2 molar ratio. The control spectra, Cx40CT only (black), have been overlapped with spectra obtained when both molecules were present at a 1:2 molar ratio (red). The amino acid peaks that were affected have been labeled. (B) Close-up view from A (dotted box) to illustrate a sample of the affected amino acids. (C) Summary of the Cx40CT residues affected by the presence of the ZO-1 PDZ-2 domain. Residues that disappeared (green) and decreased in intensity (grey) have been labeled.
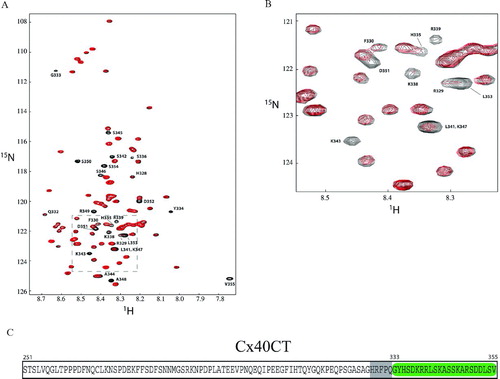
Figure 3 Change in chemical shift intensities on Cx40CT binding to the ZO-1 PDZ-2 domain. (A) 1H15N-HSQC titration of 15N-Cx40CT with unlabeled PDZ-2 in which the Cx40CT:PDZ-2 concentration ratios ranged from 1:0 to 1:5. Each titration contained the same concentration of 15N-Cx40CT (20 μ M) with different concentrations of the PDZ-2 domain. The cross-peak color changes according to the concentration ratio (Cx40CT:PDZ-2 1:0 [black], 1:0.5 [red], 1:1 [green], 1:2 [blue], 1:2.5 [magenta], 1:3.5 [black], 1:5 [cyan]). The arrow points in the direction of the increasing PDZ-2 concentrations. The overlapped spectra have been offset for easier visualization of the decrease in signal intensity. A294 is the control demonstrating a Cx40CT residue that had no change in signal intensity. (B) The dissociation constant (KD) for the Cx40CT/PDZ-2 interaction was estimated by fitting the observed decreases in signal intensity for Cx40CT residues R349, S350, S354, and V355 as a function of PDZ-2 concentration.
![Figure 3 Change in chemical shift intensities on Cx40CT binding to the ZO-1 PDZ-2 domain. (A) 1H15N-HSQC titration of 15N-Cx40CT with unlabeled PDZ-2 in which the Cx40CT:PDZ-2 concentration ratios ranged from 1:0 to 1:5. Each titration contained the same concentration of 15N-Cx40CT (20 μ M) with different concentrations of the PDZ-2 domain. The cross-peak color changes according to the concentration ratio (Cx40CT:PDZ-2 1:0 [black], 1:0.5 [red], 1:1 [green], 1:2 [blue], 1:2.5 [magenta], 1:3.5 [black], 1:5 [cyan]). The arrow points in the direction of the increasing PDZ-2 concentrations. The overlapped spectra have been offset for easier visualization of the decrease in signal intensity. A294 is the control demonstrating a Cx40CT residue that had no change in signal intensity. (B) The dissociation constant (KD) for the Cx40CT/PDZ-2 interaction was estimated by fitting the observed decreases in signal intensity for Cx40CT residues R349, S350, S354, and V355 as a function of PDZ-2 concentration.](/cms/asset/87ad9fc3-486c-493c-b498-98f0c08cdcb0/icac_a_301600_uf0003_b.jpg)
Figure 4 1H15N-HSQCs of the Cx40 carboxyl terminus (Cx40CT) in the presence of the SH3 domain of c-Src. This experiment allowed for detection of the regions of Cx40CT that were structurally modified when in the presence of a binding domain from the molecular partner c-Src. (A) Cx40CT was titrated with the SH3 domain of c-Src to a 1:4 molar ratio. The control spectra, Cx40CT only (black), have been overlapped with spectra obtained when both molecules were present at a 1:4 molar ratio (red). The amino acid peaks that were affected have been labeled. (B) Close-up view from panel A (dotted box) to illustrate a sample of the affected amino acids. (C) Summary of the Cx40CT residues affected by the presence of the c-Src SH3 domain. Residues that shifted ≥ 0.035 ppm (red) and < 0.035 ppm (grey) have been labeled.
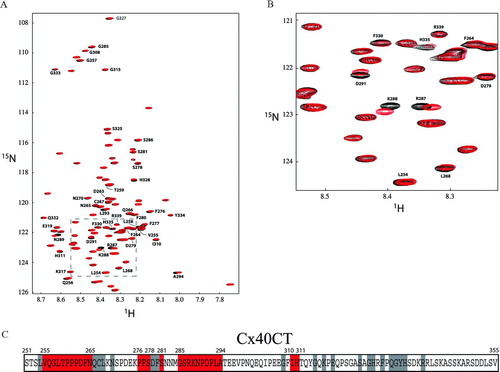
Figure 5 Change in chemical shift position on Cx40CT binding to the c-Src SH3 domain. (A) 1H15N-HSQC titration of 15N-Cx40CT with unlabeled SH3 in which Cx40CT:SH3 concentration ratios ranged from 1:0 to 1:32. Each titration contained the same concentration of 15N-Cx40CT (100 μ M) with different concentrations of the c-Src SH3 domain. The cross-peak color changes according to the concentration ratio (Cx40CT:SH3 1:0 [black], 1:1 [green], 1:7 [blue], 1:13 [red], 1:32 [black]). The arrow points in the direction of the increasing SH3 concentrations. Titrations of 1:0.6, 1:4, 1:10, 1:16, and 1:24 were also collected and used for calculating the dissociation constant (B), but were not included for easier visualization of the chemical shift changes. N300 is the control demonstrating a Cx40CT residue that did not shift. (B) The dissociation constant (KD) for the Cx40CT/SH3 interaction was estimated by fitting the change in chemical shift (Δ δ) for Cx40CT residues G257, Q256, R287, and N289 as a function of SH3 concentration. The Δ δ was calculated according to the formula Δ δav = √((Δ δHN)2+ (Δ δ N/5)2).
![Figure 5 Change in chemical shift position on Cx40CT binding to the c-Src SH3 domain. (A) 1H15N-HSQC titration of 15N-Cx40CT with unlabeled SH3 in which Cx40CT:SH3 concentration ratios ranged from 1:0 to 1:32. Each titration contained the same concentration of 15N-Cx40CT (100 μ M) with different concentrations of the c-Src SH3 domain. The cross-peak color changes according to the concentration ratio (Cx40CT:SH3 1:0 [black], 1:1 [green], 1:7 [blue], 1:13 [red], 1:32 [black]). The arrow points in the direction of the increasing SH3 concentrations. Titrations of 1:0.6, 1:4, 1:10, 1:16, and 1:24 were also collected and used for calculating the dissociation constant (B), but were not included for easier visualization of the chemical shift changes. N300 is the control demonstrating a Cx40CT residue that did not shift. (B) The dissociation constant (KD) for the Cx40CT/SH3 interaction was estimated by fitting the change in chemical shift (Δ δ) for Cx40CT residues G257, Q256, R287, and N289 as a function of SH3 concentration. The Δ δ was calculated according to the formula Δ δav = √((Δ δHN)2+ (Δ δ N/5)2).](/cms/asset/02678936-97d5-416d-911f-cc3fde8b04b3/icac_a_301600_uf0005_b.jpg)
Figure 6 1H15N-HSQCs demonstrating the Cx40CT interacts simultaneously with the ZO-1 PDZ-2 and c-Src SH3 domains. The Cx40CT residues that disappeared due to the Cx43CT/PDZ-2 interaction (G333-V355; green) and shifted ≥ 0.035 ppm due to the addition of the SH3 domain (V255-N265, F276-S278, S281, G285-A294, and I310-H311; black) have been labeled. Colors correspond to 1H15N-HSQC spectra of Cx40CT alone (black), Cx40CT combined with unlabeled PDZ-2 (green), 15N-Cx40CT/ZO-1 PDZ-2/c-Src SH3 (1:2:2 molar ratio; blue), and 15N-Cx40CT/ZO-1 PDZ-2/c-Src-SH3 (1:2:4 molar ratio; red). Each sample contained the same concentration of 15N-Cx40CT (100 μ M).
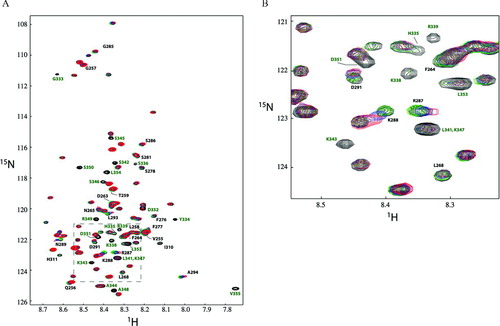
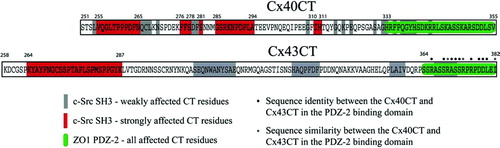
Figure 7 Comparison of the Cx40CT and Cx43CT residues affected by the interaction with the ZO-1 PDZ-2 and c-Src SH3 domains. Data for the Cx43CT interaction with the ZO-1 PDZ-2 and c-Src SH3 domains was obtained from (Sorgen et al. Citation2004a).