Figures & data
Figure 1. Klf4 deficient cells exhibit an altered morphology associated with migration when compared to cells expressing Klf4. (A) Representative wild type and Klf4-null MEFs morphology. Early passage cells were imaged using brightfield at 10× magnification. (B) Quantification of migratory morphology in A with n = 9 and p ≤ .0001. (C) Repeat of procedure in A, but using ethanol and PA-treated RKO cells. (D) Quantification of migratory morphology in C with n = 3 and p = .0036. (E) Representative wild type and Klf4-null MEFs stained with phalloidin 555 nm at 40× magnification. (F) Quantification of phalloidin-stained actin structures for wild type and Klf4-null MEFs, n = 3 and p = .0071 (stress fibers), p = .7481 (filopodia), and p = .7598 (lamellipodia). Arrows indicate a migratory phenotype. **Indicates p ≤ .01, *** indicates p ≤ .001. Error bars indicate standard deviation of replicates.
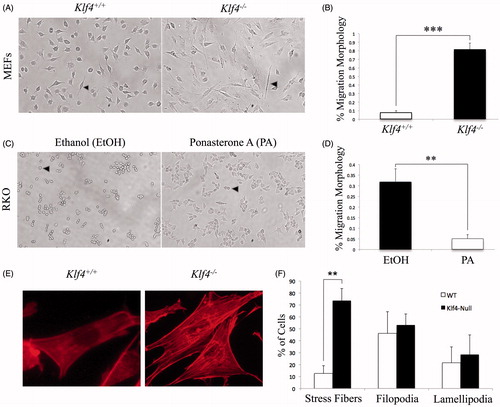
Figure 2. Klf4 deficient cells present with increased migration as well as invasive trend compared to cells expressing Klf4. (A) Wild type and Klf4-null MEF monolayer scraped with a pipette in 1% serum starvation and imaged at 4× magnification. (B) Ethanol and PA treated RKO cell monolayer in 1% serum starvation imaged at 4× magnification. (C) Quantification of averaged fold decrease in area of A between t = 0 and t = 7.5, n = 5 with a p value of .041. (D) Quantification of averaged fold decrease in area of B between t = 0 and t = 12, n = 3 with a p value of .0028. * indicates p ≤ .05, ** indicates p ≤ .01. (E) Matrigel invasion assay after 72-hour incubation period, after which invasive cells were stained and documented via brightfield microscopy at 10× magnification. (F) Quantification of number of cells present in each respective well; n = 2 for MEFs and p =.196. Error bars indicate standard deviation of replicates.
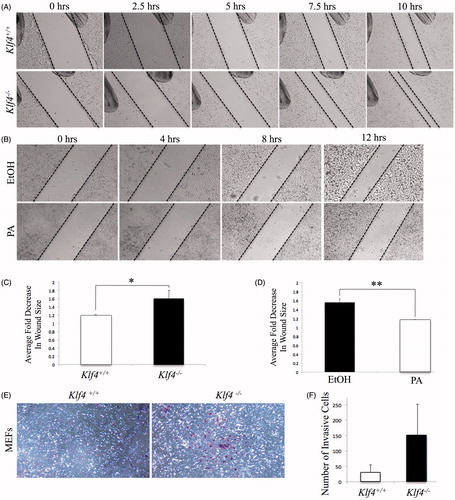
Figure 3. Reintroduction of Klf4 reduces stress fiber formation in Klf4-null MEFs. A) Representative images of DAPI and Phalloidin 555 stained images at 20× magnification. Arrows indicate boxed in cells showing representative cells of the population. (B) Quantification of stress fibers in A with n = 3 and p = .0097 for Klf4-GFP and GFP-transfected MEFs and n = 3 and p = .00731 for mock wildtype and mock Klf4-null transfected MEFs. ** indicates p ≤ .01. Error bars indicate standard deviation of replicates.
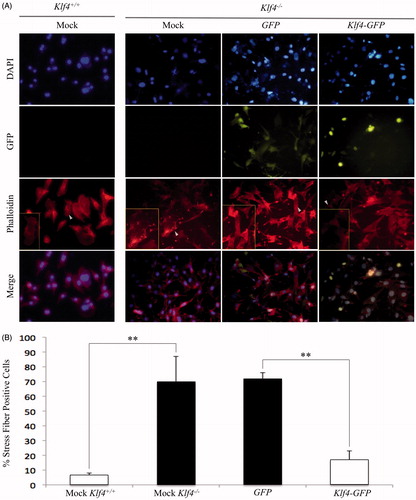
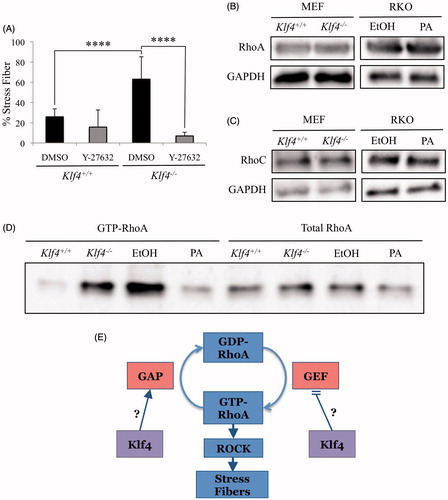
Figure 4. Klf4 deficient cells have elevated GTP-RhoA. (A) Quantification of phalloidin acti-stain 555 and DAPI co-stained MEFs, either wildtype or Klf4-null, treated with Y-27632 for 24 hours at 10μM; n = 3. **** indicates p < .0001. (B) Representative images of western blots. RhoA primary (21 kDa) antibody, GAPDH (37 kDa) antibody. (C) Representative western blots hybridized with RhoC (19 kDa) antibody, GAPDH (37 kDa) antibody. (D) Representative RhoA activity assay and western blotting of lysate from the RhoA activity assay prior to GTP-RhoA isolation with n = 3. (E) Proposed mechanism of Klf4 in stress fiber formation. Error bars indicate standard deviation of replicates.