Figures & data
Table 1. List of primers for qRT-PCR.
Figure 1. Scanning electron microscopy images of electrospun (A) PU and (B) PU-drug nanofibrous mats.
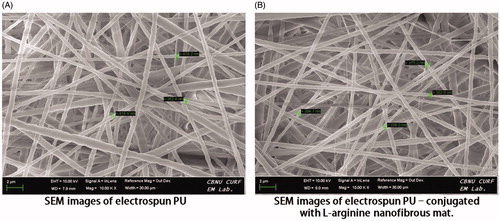
Figure 2. (A) DPPH• radical-scavenging activity of PU-nanofiber coated with l-arginine (5, 10, 20, and 40 mg) and PU-nanofiber non-coated with l-arginine (5, 10, 20, and 40 mg). Absorbance values were converted to scavenging effects (percent). (B) ABTS+ radical-scavenging activity of PU-nanofiber coated with l-arginine (5, 10, 20, and 40 mg) and PU-nanofiber non-coated with l-arginine (5, 10, 20, and 40 mg). Absorbance values were converted to scavenging effects (percent). (C) Cell proliferation was detected by trypan blue staining. (MC)-satellite cells (monoculture); (MC + H2O2) satellite cells (monoculture)+H2O2; (MC + C–NF + H2O2)-satellite cells (monoculture) treated with conjugated nanofiber + H2O2; (CC)-satellite cells (co-culture); (CC + H2O2)-satellite cells (co-culture) + H2O2; (CC + C–NF + H2O2)-satellite cells (co-culture) treated with conjugated nanofiber + H2O2. Values are presented as mean ± SD from six determinations. Large characters indicate significant differences among PU-nanofiber coated with l-arginine groups at p < 0.01; **significant compared to the control group at p < 0.01.
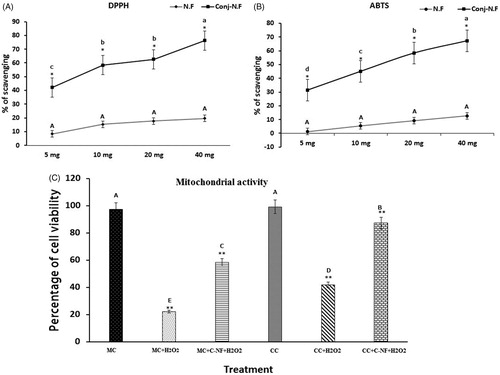
Figure 3. (A) Cellular morphological changes observed under a fluorescence microscope using OA/EtBr staining (×20). (MC)-satellite cells (monoculture); (MC + H2O2) satellite cells (monoculture)+H2O2; (MC + C-NF + H2O2)-satellite cells (monoculture) treated with conjugated nanofiber + H2O2; (CC)-satellite cells (co-culture); (CC + H2O2)-satellite cells (co-culture) + H2O2; (CC + C-NF + H2O2)-satellite cells (co-culture) treated with conjugated nanofiber + H2O2. (B) Bar graph represents the quantitative comparison among the groups. (C) H2O2-induced apoptosis and necrosis rate in mono- and co-culture satellite cells in the presence of PU-nanofiber coated with l-arginine or PU-nanofiber non-coated with l-arginine. (C) Bar graph represents the quantitative comparison among the groups.
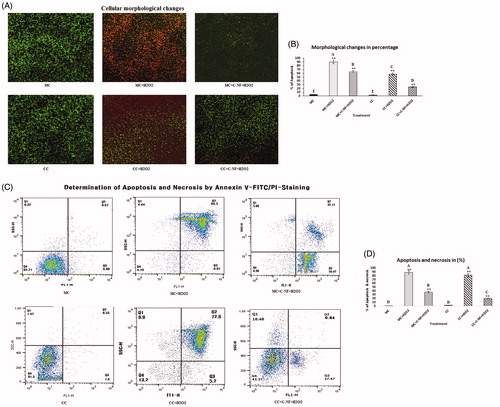
Figure 4. (A) ROS generation in H2O2-induced satellite cells under mono- and co-culture conditions. (C) Microscopic images showing damage and repair of DNA damage by comet assay. (MC)-satellite cells (monoculture); (MC + H2O2) satellite cells (monoculture)+H2O2; (MC + C-NF + H2O2)-satellite cells (monoculture) treated with conjugated nanofiber + H2O2; (CC)-satellite cells (co-culture); (CC + H2O2)-satellite cells (co-culture) + H2O2; (CC + C-NF + H2O2)-satellite cells (co-culture) treated with conjugated nanofiber + H2O2. (B and C) Bar graph represents the quantitative comparison among the groups. Values are given as mean ± SD of six determinations. Large characters indicate significant differences among PU-nanofiber coated with l-arginine groups at p < 0.01; **significant as compared to the control group at p < 0.01.
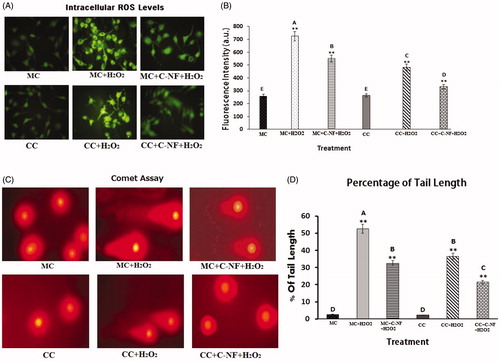
Figure 5. (A) 3D images of morphological changes in treated cells observed by SEM. (B) Immunocytochemistry of cas-3 expression. (MC)-satellite cells (monoculture); (MC + H2O2) satellite cells (monoculture)+H2O2; (MC + C-NF + H2O2)-satellite cells (monoculture) treated with conjugated nanofiber + H2O2; (CC)-satellite cells (co-culture); (CC + H2O2)-satellite cells (co-culture) + H2O2; (CC + C-NF + H2O2)-satellite cells (co-culture) treated with conjugated nanofiber + H2O2. (C) Image-Pro Plus software was used to quantitate fluorescence intensities. Bar graph represents the quantitative comparison among the groups. All the values were expressed as means of six (n = 6) determinations.
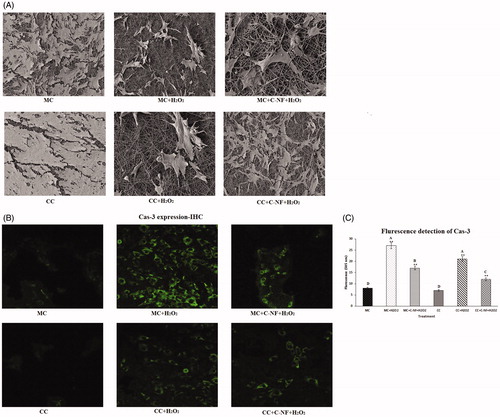
Figure 6. (A) Western blot showed that expression levels of bcl-2, cas-3, and cas-7. (MC)-satellite cells (monoculture); (MC + H2O2) satellite cells (monoculture)+H2O2; (MC + C-NF + H2O2)-satellite cells (monoculture) treated with conjugated nanofiber + H2O2; (CC)-satellite cells (co-culture); (CC + H2O2)-satellite cells (co-culture) + H2O2; (CC + C-NF + H2O2)-satellite cells (co-culture) treated with conjugated nanofiber + H2O2. (B) Bar graph represents the quantitative comparison among the groups. Data are expressed as a relative intensity ratio compared to β-actin. Values are presented as mean ± SD from six determinations. Large characters indicate significant differences among PU-nanofiber coated with l-arginine groups at p < 0.01; **significant as compared to the control group at p < 0.01. Data are expressed as the ratio of the relative intensity with β-actin.
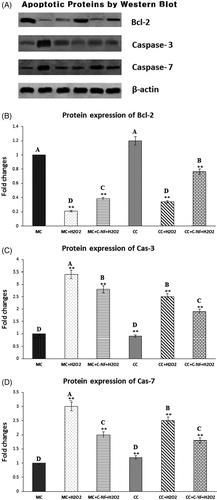
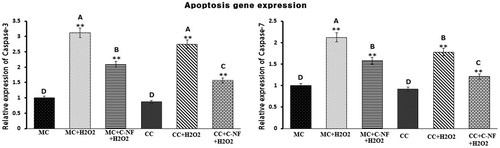
Figure 7. Bar diagram representing RT-PCR results of cas-3 and cas-7. The results depicted are normalized to levels of β-actin and expressed relative to the control. (MC)-satellite cells (monoculture); (MC + H2O2) satellite cells (monoculture)+H2O2; (MC + C-NF + H2O2)-satellite cells (monoculture) treated with conjugated nanofiber + H2O2; (CC)-satellite cells (co-culture); (CC + H2O2)-satellite cells (co-culture) + H2O2; (CC + C-NF + H2O2)-satellite cells (co-culture) treated with conjugated nanofiber + H2O2. Large characters indicate significant differences among PU-nanofiber coated with l-arginine groups at p < 0.01; **significant as compared to the control group at p < 0.01.