
Figures & data
Figure 1. Design of silk face covering.
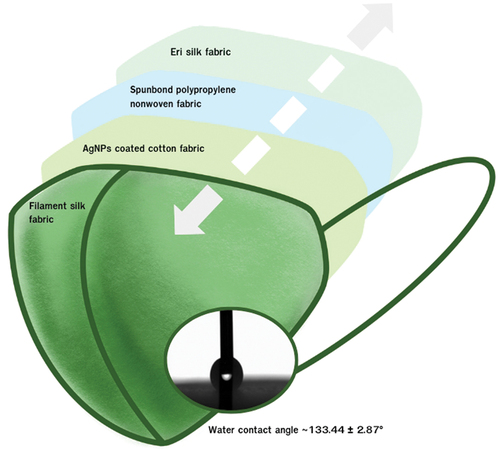
Figure 2. The synthesis of silver nanoparticles using G. mangostana peel extract (a) Photographs showing color changes after synthesized at 90°C for 3 h (B) UV–visible spectra of the synthesized AgNPs.
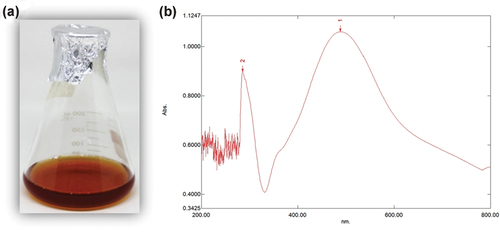
Figure 3. EDS spectra recorded from a film, after formation of AgNPs different X-ray emission peaks labeled.
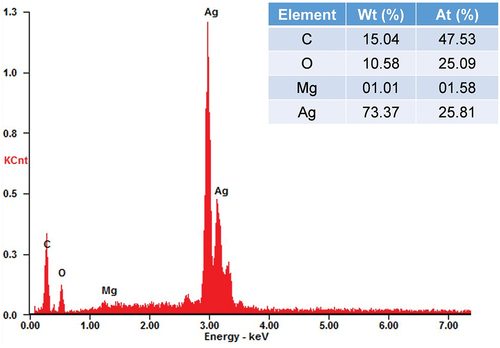
Figure 4. FESEM micrograph of AgNPs synthesized using the G. mangostana peel extract with accelerating voltage of 2 kV at a magnification of (A) 15000× and (B) 45000×.
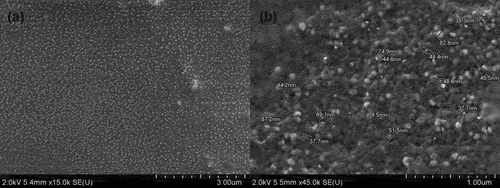
Figure 5. FT-IR spectrum of biosynthesized AgNPs by the G. mangostana peel extract.
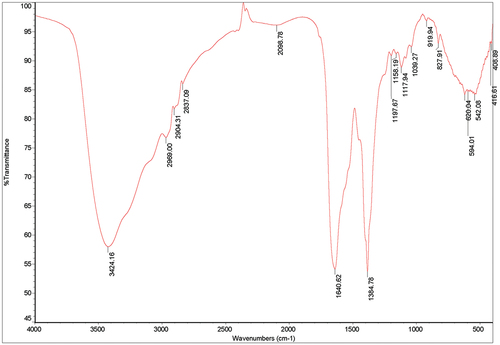
Figure 6. SEM micrograph of AgNPs coated on cotton fabric with accelerating voltage of 10 kV at a magnification of 5,000× (A) CE100 and (B) CE100-30W.
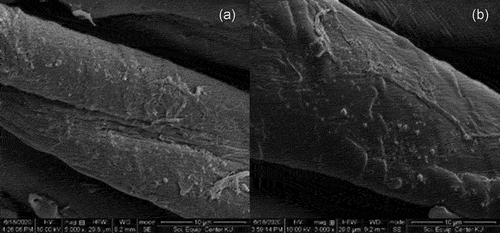
Figure 7. EDX spectroscopy of (A) CE100 and (B) CE100-30W.
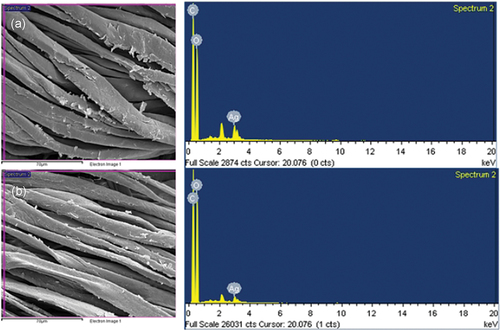
Table 1. Amount of silver contained in AgNP-coated cotton fabric (CE100) and AgNP-coated cotton fabric after 30 wash cycles (CE100-30W).
Figure 8. FT-IR spectra of (A) uncoated, (B) CE100, and (C) CE100-30W.
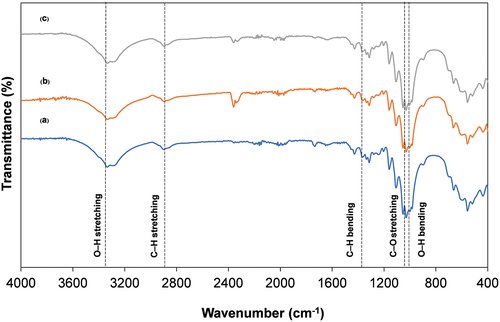
Table 2. Viable bacterial counts (cfu/ml) at zero and 18-h contact time intervals with uncoated cotton fabric (CE), CE100, and CE100-30W.
Table 3. Performance properties of the barrier face covering.