
Figures & data
Figure 1. (a) cultured ADMSCs strongly expressed the positive markers CD73, and CD90, in contrast to isotype controls. Expression of the ADMSC negative cell surface markers CD11b, CD31, CD34, and CD45 did not differ from that of the isotype control. (b) adipose-derived mesenchymal stem cells display multilineage differentiation, suggesting that they are ADMSCs. Alizarin red S, alcian blue, and oil red O staining confirmed osteogenic differentiation, chondrogenic differentiation, and adipogenic differentiation, respectively. (c) timeline of the distribution of QD-labeled ADMSCs following intravenous administration. (d) schematic illustration of the experiment design of M2-macrophages polarization by ADMSC co-culture; note that ADMSC co-culture increased the percentage of CD68 (pan-macrophage marker) and CD163 (M2-macrophage marker) and significantly increased CD163 from M1-macrophages.
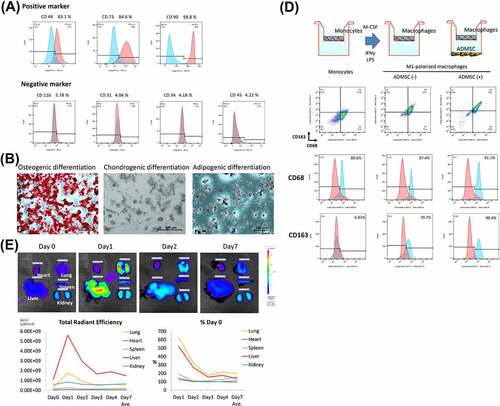
Figure 2. Macroscopic and microscopic findings of a control (non-decellularized) and decellularized bronchus. (a) the decellularized bronchus after nine cycles of the detergent enzymatic method is characterized by complete decolorization and maintains sufficient structural rigidity. (b, c) H&E staining of the decellularized bronchus shows that all cells were removed in the mucosa, submucosa, muscles, and adventitia. Only a small number of nuclei remain in the thick cartilage as compared with that in the native bronchus. (d) alcian blue staining for proteoglycans shows a mild decrease of the cartilage substrate in decellularized bronchial cartilage (arrow). (e) immunohistochemistry for laminin, fibronectin, and collagen IV in the decellularized bronchus. (f) quantification of residual DNA after decellularization of pig bronchus until 12 cycles of detergent enzymatic treatment; n = 3 for all groups.
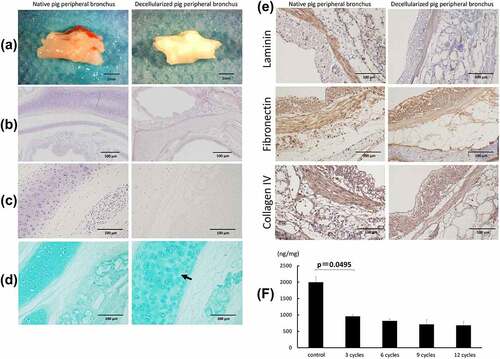
Figure 3. Gross finding of transplanted pig decellularized bronchus at surgery and microscopic findings of implanted pig bronchus in a rat tracheal defect on day 7 post implantation. Xenograft group: BN rats implanted with native pig bronchi; decellularized xenograft group: BN rats implanted with decellularized pig bronchi; decellularized xenograft +ADMSC group: BN rats implanted with decellularized pig bronchi and injected with 1 × 10Citation6 ADMSCs. A cross-section of the trachea of a healthy rat is presented for reference. (a) decellularized pig bronchus is sutured at the upper portion of the rat tracheal defect (white arrow). (b) H&E staining shows typical histopathological changes associated with acute rejection, including the destruction of the cartilage matrix and lymphocyte infiltration in the xenograft group. Under high-magnification field views, acute rejection was mild in the decellularized xenograft and decellularized xenograft +ADMSC groups. In particular, the decellularized xenograft +ADMSC group shows low infiltration of inflammatory cells (arrows) and less collagen deposition. (c) inflammatory cell count in each group per high-power field (HPF). Note that the count of inflammatory cells was the lowest in the decellularized xenograft +ADMSC group after the transplantation. (d) Masson’s trichrome staining shows dense fibrotic tissue around the implanted cartilage.
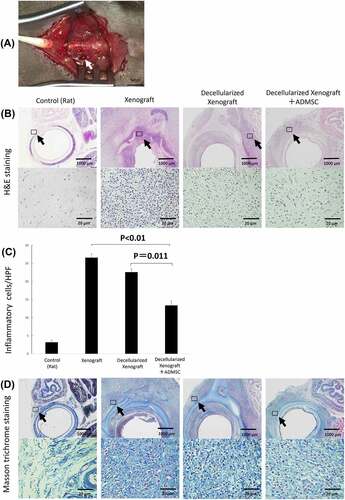
Figure 4. Immunohistochemistry of tissue surrounding the implanted graft on days 0 (n = 5), 7 (n = 5 or 7), and 28 (n = 3) post implantation. (a) low- and high-magnification views of the immunostaining for CD8, a cytotoxic T lymphocyte marker; CD68, a pan-macrophage marker; CD163, an M2 macrophage marker on day 7 post implantation. Arrowheads highlight immunopositive brown cells. The expression of IgM and IgG is reduced in the decellularized xenograft groups and is lowest in the decellularized xenograft +ADMSC group. (b) graphs representing the number of immunopositive cells in five randomly selected high-magnification microscopic fields on day 7 after implantation (n = 5 or 7) (400×; 0.0625 mm2). (c) low- and high-magnification views of the immunostaining for CD8, a cytotoxic T lymphocyte marker; CD68, a pan-macrophage marker; and CD163, an M2 macrophage marker on day 28 post implantation (n = 3). Arrowheads highlight immunopositive brown cells. Expression of CD8, CD68, and CD163 are reduced in the decellularized xenograft and decellularized xenograft +ADMSC groups. The expression of IgM and IgG is reduced in the decellularized xenograft and decellularized xenograft +ADMSC groups. (d) graphs showing the number of immunopositive cells in five randomly selected high-magnification microscopic fields on day 28 post implantation (400×; 0.0625 mm2).
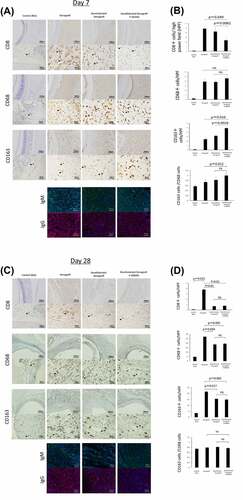
Figure 5. Serum IL-2, IFN-γ, VEGF, IL-10, and TNF-α levels on days 7 (n = 5) and 28 (n = 3) after implantation. (a) on day 7, serum VEGF and IL-10 levels in the decellularized xenograft+ADMSC group were significantly higher than those in the decellularized xenograft and xenograft groups. Levels of the proinflammatory cytokines IFN-γ and TNF-α are not different between groups. (b) on day 28, no statistical difference was observed among groups.
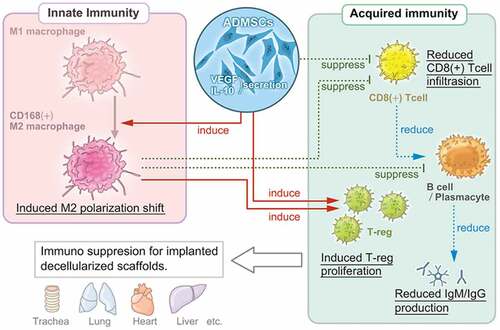
Figure 6. Multi-regulatory immunosuppressive effects of ADMSCs with respect to the implanted decellularized scaffolds. ADMSCs induce a shift in macrophage polarization toward the M2 phenotype and suppress T-cell and B-cell proliferation. The suppression of innate and acquired immunity reduces host immunoreactivity toward decellularized scaffolds.
Data availability statement
Data that support the findings of this study are available from the corresponding author upon reasonable request.