Figures & data
Figure 1. Gene expression of miR-152, miR-15a, miR-34a, and miR-223 in human multiple myeloma. (A) Expression of 4 candidate miRNAs was analyzed in MM patients (N = 18) and B cells from healthy donors (N = 16, non-MM group) by qPCR, after normalizing with the endogenous control U6. Among the 4 miRNAs, miR-152 showed the most significant downregulation compared to non-MM group (p < 0.004). (B) The expression of miR-152 in all the 18 MM samples were analyzed by log2(fold change)(ΔΔCt [MM/non-MM]). (C) Pie chart shows the percent distribution of miR-152 in downregulated, upregulated and unchanged samples from MM group.
![Figure 1. Gene expression of miR-152, miR-15a, miR-34a, and miR-223 in human multiple myeloma. (A) Expression of 4 candidate miRNAs was analyzed in MM patients (N = 18) and B cells from healthy donors (N = 16, non-MM group) by qPCR, after normalizing with the endogenous control U6. Among the 4 miRNAs, miR-152 showed the most significant downregulation compared to non-MM group (p < 0.004). (B) The expression of miR-152 in all the 18 MM samples were analyzed by log2(fold change)(ΔΔCt [MM/non-MM]). (C) Pie chart shows the percent distribution of miR-152 in downregulated, upregulated and unchanged samples from MM group.](/cms/asset/0ff452d6-0dbb-45d2-9f91-1bc999bb3ec9/krnb_a_1094600_f0001_c.gif)
Figure 2. Expression of miR-152 negatively impacted DKK-1 in MM. (A) Spearman correlation analysis showing relative expression of miR-152 and DKK1 in 18 human multiple myeloma patients. An inverse correlation between miR-152 and DKK1 was observed (p < 0.001, R2 = 0.27). (B) Expression of miR-152 in one of the each representative MM and non-MM samples (upper panel). Significant difference at **p<0.01 in MM vs. non-MM from 3 independent experiments. Corresponding immunohistochemistry of DKK1 expression (lower panel) indicates an inverse relationship with miR-152. (C) Expression of DKK1 levels in 6 normal B cells and 8 MM cell lines as determined by Western blotting (upper panel). Levels of DKK1 were reduced in the B cells compared to the MM cell lines. β-actin was used as the loading control. Likewise, very low levels of DKK1 mRNA were found in the B-cells, while high and intermediate levels of DKK1 mRNA were found in the MM cell lines. (D) Expression of miR-152 in B cells and MM cell lines demonstrate high mRNA levels in the B cells compared to MM cell lines. Statistical significances at *p < 0.05 and **p < 0.001 vs. B cells in both (C) and (D) from 3 independent experiments. The band intensity of DKK1 was normalized against that of β-actin, and the ratios (Mean ± SD) were shown at the WB band bottom for 3 independent assay.
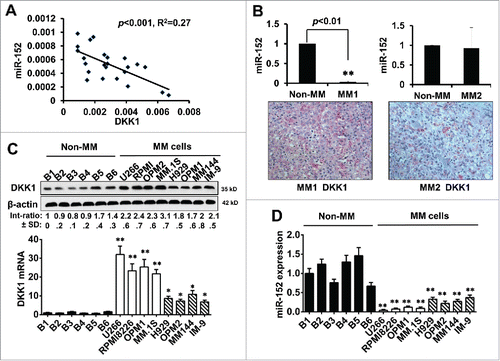
Figure 3. Modulation of miR-152 governs DKK-1 expression in MM cell lines. Overexpression of miR-152 by transfection with a mimic for 48 h decreased (A) DKK1 mRNA and (B) protein levels compared with non-target control (NT Ctrl) in the MM cell lines. (C) Suppression of miR-152 with an inhibitor for 48 h resulted in the upregulation of DKK1 mRNA. Effect of NT control was negligible. (D) Expression of DKK1 in the above MM cells was increased corresponding with the downregulation of miR-152 by the inhibitor. Statistical significances at *p < 0.05 and **p < 0.001 vs. NT Ctrl in both (A) and (C) from 3 independent experiments. The band intensity of DKK1 was normalized against that of β-actin in 4 MM cell lins, and the ratios (Mean ± SD) were shown at the WB band bottom for 3 independent assay.
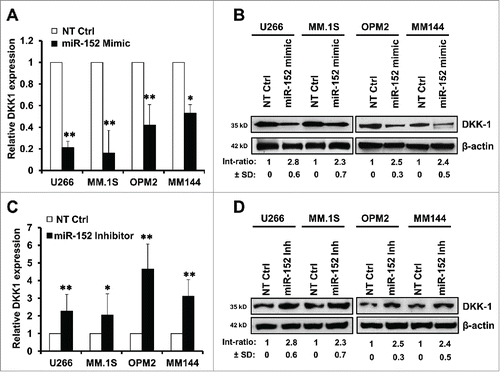
Figure 4. Binding of miR-152 to the 3′ UTR blocks DKK1 activity. (A) MM.1S and OPM-2 cells were infected with either DKK1 mRNA 3′UTR reporter plasmid (pMIR-DKK1-3′UTR-wt) or the mutant with 3 miR-152 binding sites changed (pMIR-DKK1-3′UTR-mt), and luciferase activity was evaluated. Upper panel shows the wild-type binding sites, while the lower panel demonstrates that the relative luciferase activity is declined in the presence of increasing concentration of the miR-152 mimic compared with non-target control (NT Ctrl), indicating overexpression of miR-152 by mimic decreased DKK1 activity considerably. (B) Upper panel shows mutated binding sites (the changed sites are shown in dotted lines). There was no change in the luciferase activity in presence of mimic after mutating the binding sites (lower panel), indicating feeble effects on the DKK1 activity. (C) Relative luciferase activity of DKK1 was upregulated in the absence of miR-152 overexpression or inhibitor treatment. (D) As observed previously, DKK1 activity was unaffected on mutating the binding sites, even in the presence of a miR-152 inhibitor. Statistical significances at *p < 0.05 and **p < 0.001 vs. respective NT Ctrl in (A) and (C) from 3 independent experiments.
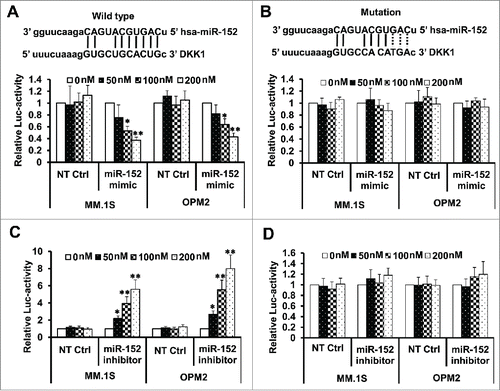
Figure 5. Targeting DKK-1 activity by the combination of miR-152 mimic and melphalan sensitizes MM cells to apoptosis. Flow cytometry assays were performed using Annexin V-FITC and PI to show the apoptotic cells in MM.1S or OPM-2 cells treated with NT control, miR-152 mimic or melphalan in different combinations. (A) miR-152 mimic in conjunction with melphalan induced noticeable apoptotic effects in the MM cells compared with either agent alone in both cell lines (B) Quantitative estimation of percent apoptotic cells from 3 independent experiments. Statistical significances at *p<0.05 vs. mimic or NT Ctrl and **p < 0.001 vs. mimic or melphalan and/or NT Ctrl. (C) MM.1S and OPM-2 cells were transfected with 100 nM of miR-152 mimic or NT Ctrl for 48 h, exposed to 5 µM of melphalan, cultured for 24 h, and the lysates were detected for the cleavage of PARP (c-PARP) proteins by Western blotting. Bands showing the cleavage of PARP in MM.1S or OPM-2 cells treated with specific agents are as indicated. The band intensity of c-PARP was normalized against that of β-actin and the ratios (Mean ± SD) were shown at the WB band bottom for 3 independent assay.
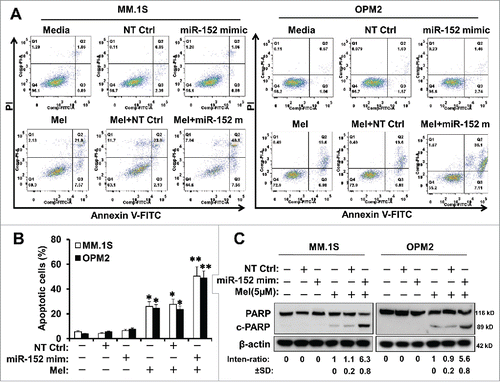
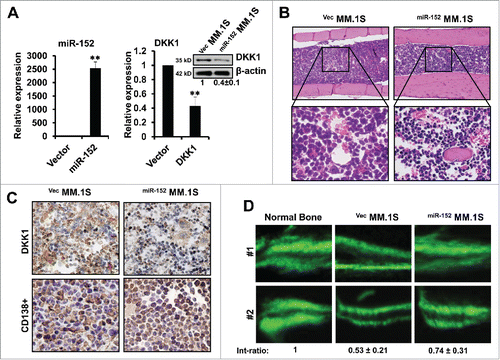
Figure 6. Over-expression of miR-152 alleviates bone destruction in MM in vivo. (A) Stably expressing miR-152 or empty vector infected MM.1S cells were injected into bone marrow of mice for the development of MM. Levels of miR-152 (left panel) and DKK1 mRNA and protein (right panel) are obtained from the mice bone marrow, when the disease is confirmed. Statistical significances at **p < 0.001 vs. empty vector from 3 independent experiments. (B) H&E staining showing equal and successful injection of 0.5×10⁶ VecMM.1S and miR-152MM.1S cells into mice bone marrow. (C) Representative immunohistochemical staining of DKK1 (upper panel) and CD138+ (lower panel) in the VecMM.1S and miR-152MM.1S cells obtained from the mice bone marrow. (D) Representative fluorescent micrographs of dual calcein labeling of femur bone from 2 mice injected with 0.5×10⁶ VecMM.1S and miR-152MM.1S cells. The distance between the 2 calcein labeling layers reflects the bone mineralization rate, and the analysis of the intensity ratio between the VecMM.1S group and the miR-152MM.1S groups were shown at the bottom. Bars represent the mean ± SEM of n = 10 mice per group (*P < 0.05).
