730
Views
10
CrossRef citations to date
0
Altmetric
Research Article

Evaluation of Acute Immunotoxicity of Aerosolized Aflatoxin B1 in Female C57BL/6N Mice

, , , , , , , & show all
Pages 11-20 | Received 08 Aug 2005, Accepted 24 Oct 2005, Published online: 09 Oct 2008

Figures & data

TABLE 1 Experimental design

TABLE 2 Exposure concentration of AFB1 aerosol

TABLE 3 Summary of organ weights

TABLE 4 Summary of organ/body weight ratios

TABLE 5 White blood cell count

FIG. 1 Splenocytes were isolated from mouse spleen three days following exposure to aerosol containing 0 μ g AFB1/L (aerosolized vehicle, ethanol; A), 2.86 μ g AFB1/L (B), 6.59 μ g AFB1/L (C) or 10.0 μ g AFB1/L (D). The quantities of different lymphocyte subpopulations for aerosol-exposed animals is shown by the solid bar. Lymphocyte subpopulations of splenocytes isolated from untreated mice and cyclophosphamide-treated mice on the same day are illustrated by the open and dotted bars, respectively. Antigenic markers were used to identify and quantitate T-cells (CD3+), helper T-cells (CD3+/CD4+), cytotoxic T-cells (CD3+/CD8+), B cells (CD19+) and natural killer cells (NK1.1+) from the isolated splenocytes by fluorescent-activated cell sorting (FACS) as described in the Methods. An asterisk indicates that the value is significantly different from the untreated mice (open bar) using a Student's 2-tailed t-test at p ≤ 0.05.
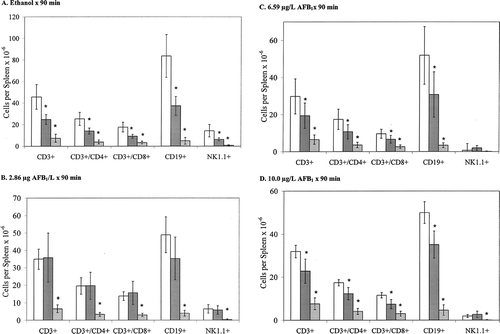
FIG. 1 Splenocytes were isolated from mouse spleen three days following exposure to aerosol containing 0 μ g AFB1/L (aerosolized vehicle, ethanol; A), 2.86 μ g AFB1/L (B), 6.59 μ g AFB1/L (C) or 10.0 μ g AFB1/L (D). The quantities of different lymphocyte subpopulations for aerosol-exposed animals is shown by the solid bar. Lymphocyte subpopulations of splenocytes isolated from untreated mice and cyclophosphamide-treated mice on the same day are illustrated by the open and dotted bars, respectively. Antigenic markers were used to identify and quantitate T-cells (CD3+), helper T-cells (CD3+/CD4+), cytotoxic T-cells (CD3+/CD8+), B cells (CD19+) and natural killer cells (NK1.1+) from the isolated splenocytes by fluorescent-activated cell sorting (FACS) as described in the Methods. An asterisk indicates that the value is significantly different from the untreated mice (open bar) using a Student's 2-tailed t-test at p ≤ 0.05.

TABLE 6 Effect of AFB1 on CD4+/CD8+ ratio of mouse splenocytes

TABLE 7 IgM response to keyhole limpet hemocyanin (KLH)

Reprints and Corporate Permissions

Please note: Selecting permissions does not provide access to the full text of the article, please see our help page How do I view content?

To request a reprint or corporate permissions for this article, please click on the relevant link below:

Academic Permissions

Please note: Selecting permissions does not provide access to the full text of the article, please see our help page How do I view content?

Obtain permissions instantly via Rightslink by clicking on the button below:

If you are unable to obtain permissions via Rightslink, please complete and submit this Permissions form. For more information, please visit our Permissions help page.