Figures & data
TABLE 1 Preliminary phytochemical study on M.oleifera seed extract
TABLE 2 List of major phytochemical constituents of the seeds of M. oleifera
TABLE 3 Total cells and differential leukocyte counts in blood (×103 cells/ml)Footnotea
TABLE 4 Total cells and differential leukocyte count in BAL fluid (×105 cells/ml)
FIG. 1 Serum TNFα levels in rats. *Value significantly different from non-arthritic control (p < 0.001); value different from TDI-controls ($ p < 0.05). Values shown are the mean ± SEM from non-sensitized controls, sensitized controls (DC), and treatment regimen rats (DEXA = dexamethasone; MO1 = MOEE 100 mg/kg; MO2 = MOEE 200 mg/kg; n = 8 rats/group).
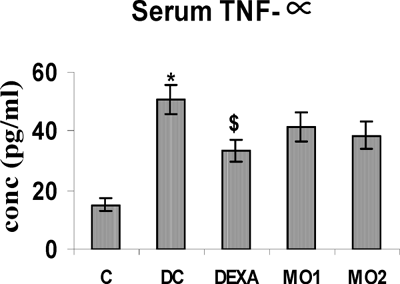
FIG. 2 Serum IL-4 levels in rats. *Value is significantly different from nonsensitized control (p < 0.001); value significantly different from TDI-controls (@ p < 0.001, # p < .01). Values shown are the mean ± SEM from non-sensitized controls, sensitized controls (DC), and treatment regimen rats (DEXA = dexamethasone; MO1 = MOEE 100 mg/kg; MO2 = MOEE 200 mg/kg; n = 8 rats/group).
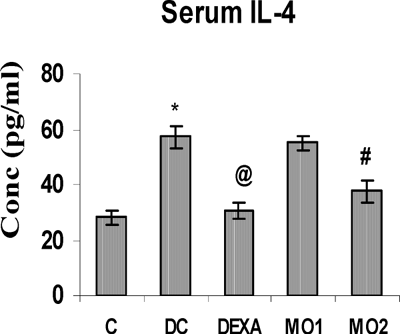
FIG. 3 Serum IL-6 level in rats. *Value is significantly different from non-sensitized control (p < 0.001); value significantly different from TDI-controls (# p < 0.01, $ p < 0.05). Values shown are the mean ±SEM from non-sensitized controls, sensitized controls (DC), and treatment regimen rats (DEXA = dexamethasone; MO1 = MOEE 100 mg/kg; MO2 = MOEE 200 mg/kg; n = 8 rats/group).
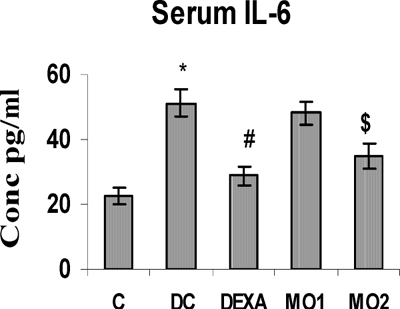
FIG. 4 BAL fluid TNFα levels in rats. *Value is significantly different from nonsensitized control (p < 0.001); value significantly different from TDI-controls (# p < 0.01, $ p < 0.05). Values shown are the mean ± SEM from non-sensitized controls, sensitized controls (DC), and treatment regimen rats (DEXA = dexamethasone; MO1 = MOEE 100 mg/kg; MO2 = MOEE 200 mg/kg; n = 8 rats/group).
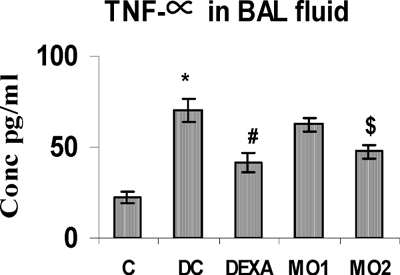
FIG. 5 BAL fluid IL-4 levels in rats. *Value is significantly different from control (p < 0.001); value significantly different from TDI-controls (@ p < 0.001). Values shown are the mean ± SEM from non-sensitized controls, sensitized controls (DC), and treatment regimen rats (DEXA = dexamethasone; MO1 = MOEE 100 mg/kg; MO2 = MOEE 200 mg/kg; n = 8 rats/group).
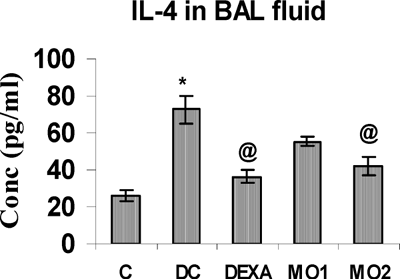
FIG. 6 BAL fluid IL-6 levels in rats. *Value is significantly different from control (p < 0.001); value significantly different from TDI-controls (@ p < 0.001, # p < 0.01, $ p < 0.05). Values shown are the mean ± SEM from non-sensitized controls, sensitized controls (DC), and treatment regimen rats (DEXA = dexamethasone; MO1 = MOEE 100 mg/kg; MO2 = MOEE 200 mg/kg; n = 8 rats/group).
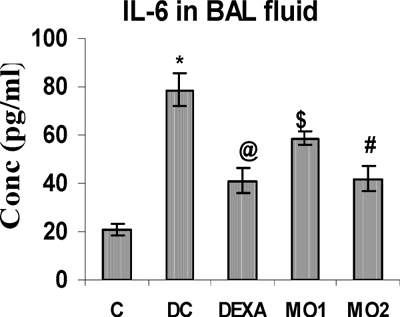
TABLE 5 Effect of MOEE on oxidative stress in TDI sensitized rats
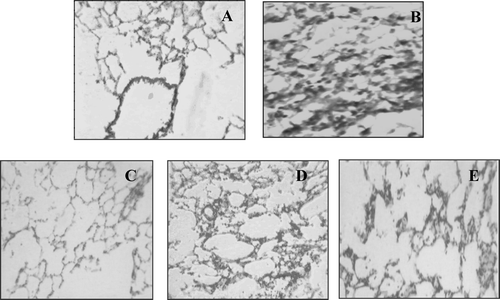
FIG. 7 Histopathological effects from the various treatments. Lung tissue sections of treated and untreated TDI sensitized animals stained with hematoxylin-eosin. (A) Shows normal view of lung pathology. (B) Shows typical damaged lung tissue from TDI-control group with total and differential leukocyte infiltration (eosinophils), reduced lumen size. (C) Shows less leukocyte infiltration lumen size by dexamethasone treatment. (D) MO1 shows less leukocyte infiltration but does not protected animal from other pathological features. (E) MO2 shows significant protection against leukocyte infiltration, and constriction of lumen size.