547
Views
13
CrossRef citations to date
0
Altmetric
Research Article

Proteomic analysis of mouse thymoma EL4 cells treated with bis(tri-n-butyltin)oxide (TBTO)

, , , , , & show all
Pages 174-183 | Received 26 Mar 2009, Accepted 18 May 2009, Published online: 25 Jun 2009

Figures & data

Figure 1. An illustration of nano-LC/MS/MS analysis of tryptic peptides obtained from TBTO-treated cells. (A) Total ion chromatogram; (B) Tandem mass spectra of the peak at retention time 28.58 min.
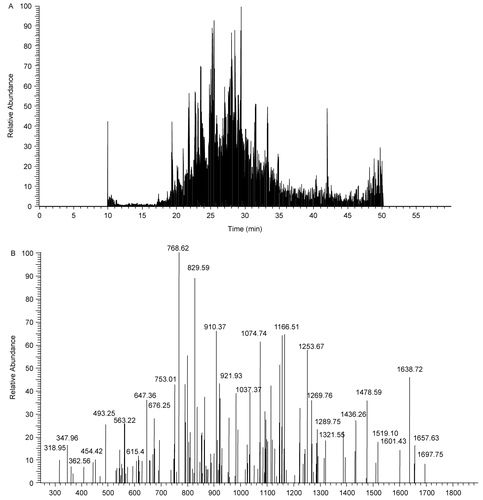
Figure 1.  An illustration of nano-LC/MS/MS analysis of tryptic peptides obtained from TBTO-treated cells. (A) Total ion chromatogram; (B) Tandem mass spectra of the peak at retention time 28.58 min.

Figure 2. Number of identified proteins common for control and TBTO-exposed sample, as well as the number proteins detected in either the control or TBTO-exposed cells.
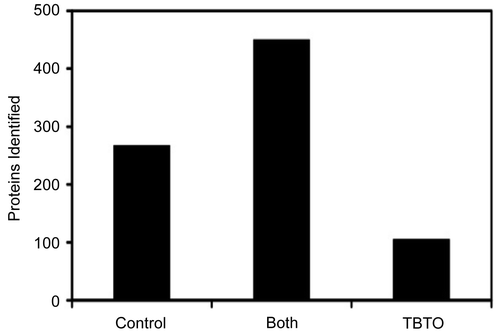
Figure 2.  Number of identified proteins common for control and TBTO-exposed sample, as well as the number proteins detected in either the control or TBTO-exposed cells.

Table 1. Proteins altered upon exposure to TBTO.

Table 2. TBTO-altered protein-fold changes compared to the corresponding mRNA ratio.

Figure 3. Protein extracts of TBTO-treated and non-treated cells (70 μg each; obtained as described in Materials and Methods) were separated by 10% SDS-PAGE, transferred onto Hybond-P PVDF membrane, and probed with rabbit anti-prothymosin-α polyclonal IgG. Detection was performed using goat anti-rabbit IgG conjugated with horseradish peroxidase and ECL Western blotting detection reagents. The numbers on the left indicate the molecular weights of the ECL markers.
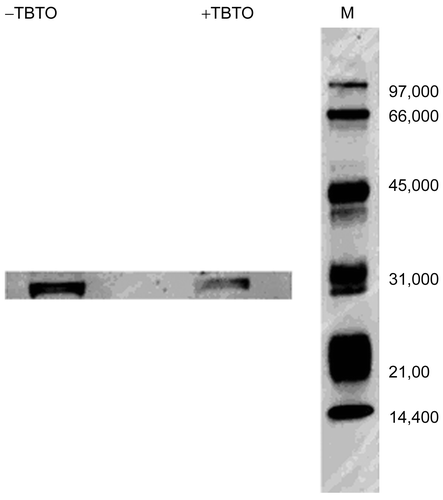
Figure 3.  Protein extracts of TBTO-treated and non-treated cells (70 μg each; obtained as described in Materials and Methods) were separated by 10% SDS-PAGE, transferred onto Hybond-P PVDF membrane, and probed with rabbit anti-prothymosin-α polyclonal IgG. Detection was performed using goat anti-rabbit IgG conjugated with horseradish peroxidase and ECL Western blotting detection reagents. The numbers on the left indicate the molecular weights of the ECL markers.
Supplemental material

Supplementary Material

Download MS Excel (201.5 KB)

Reprints and Corporate Permissions

Please note: Selecting permissions does not provide access to the full text of the article, please see our help page How do I view content?

To request a reprint or corporate permissions for this article, please click on the relevant link below:

Academic Permissions

Please note: Selecting permissions does not provide access to the full text of the article, please see our help page How do I view content?

Obtain permissions instantly via Rightslink by clicking on the button below:

If you are unable to obtain permissions via Rightslink, please complete and submit this Permissions form. For more information, please visit our Permissions help page.