611
Views
9
CrossRef citations to date
0
Altmetric
Research Article

Analysis of mechanisms of cell death of T-lymphocytes induced by organotin agents

, , &
Pages 184-193 | Received 09 Feb 2009, Accepted 08 Jun 2009, Published online: 13 Aug 2009

Figures & data

Table 1. Effect of organotin agents on thymus relative weight.

Figure 1. Thymic atrophy following organotin exposure. Relative thymus weight of rats given a single intraperitoneal injection of dibutyltin or tributyltin chloride at 2 mg/kg body weight. Treated and untreated (control) rat were euthanized at each post-exposure timepoint indicated and the thymus was removed and weighed. Results shown are the indices as percent of time-matched control rat values; mean ±SD (n=5). **p < 0.01 compared to control host values.
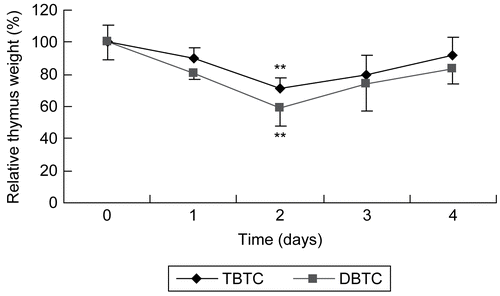
Figure 1.  Thymic atrophy following organotin exposure. Relative thymus weight of rats given a single intraperitoneal injection of dibutyltin or tributyltin chloride at 2 mg/kg body weight. Treated and untreated (control) rat were euthanized at each post-exposure timepoint indicated and the thymus was removed and weighed. Results shown are the indices as percent of time-matched control rat values; mean ±SD (n=5). **p < 0.01 compared to control host values.

Figure 2. Morphological analysis of cell death using flow cytometry. Five different cytograms of thymocytes were analyzed for viability, apoptosis, and necrosis. Thymocytes were treated with 1 μM DBTC or TBTC for the indicated times. FAM-VAD-FMK (X-axis; green fluorescence) and PI (Y-axis; red fluorescence) were then analyzed by flow cytometry. A: Control cells. B-1: Cells were exposed to DBTC for 30 min. B-2: DBTC for 60 min. C-1: TBTC for 30 min. C-2: TBTC for 60 min. Cell status was revealed by green vs. red fluorescence. Numbers shown indicate cell fractions gated in regions Q-1: necrosis, Q-2: late apoptotic cells, Q-3: live cells, and Q-4: early apoptotic cells. Relative amounts of viable, early apoptotic, late apoptotic, and necrotic thymocytes are shown. Both axes are in log scale. While the images shown are a representative cytogram from these assays, the percentage results shown in each are the mean ± SD (n=5 separate cell populations examined per treatment shown).
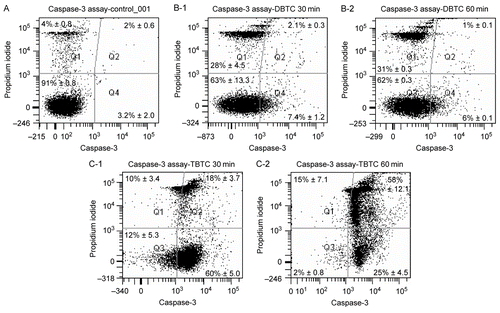
Figure 2.  Morphological analysis of cell death using flow cytometry. Five different cytograms of thymocytes were analyzed for viability, apoptosis, and necrosis. Thymocytes were treated with 1 μM DBTC or TBTC for the indicated times. FAM-VAD-FMK (X-axis; green fluorescence) and PI (Y-axis; red fluorescence) were then analyzed by flow cytometry. A: Control cells. B-1: Cells were exposed to DBTC for 30 min. B-2: DBTC for 60 min. C-1: TBTC for 30 min. C-2: TBTC for 60 min. Cell status was revealed by green vs. red fluorescence. Numbers shown indicate cell fractions gated in regions Q-1: necrosis, Q-2: late apoptotic cells, Q-3: live cells, and Q-4: early apoptotic cells. Relative amounts of viable, early apoptotic, late apoptotic, and necrotic thymocytes are shown. Both axes are in log scale. While the images shown are a representative cytogram from these assays, the percentage results shown in each are the mean ± SD (n=5 separate cell populations examined per treatment shown).

Table 2. Relative amounts of viable, early apoptotic, late apoptotic, and necrotic T-lymphocytes after treatments.

Figure 3. Activation of caspases during alkyltin-induced cell death. Whole cell lysates (5.0 μg) were prepared from thymocytes exposed to 1 μM DBTC or TBTC for the indicated times. Activation of (A) caspase-8, (B) caspase-9, and (C) caspase-3 was determined using specific fluorescent substrates Ac-IETD-MCA, Ac-LEHD-MCA, and Ac-DMQD-MCA, respectively. Fluorescence was detected using a plate reader. Date are expressed as percentage of values found at 0 hr (control). Results shown are the mean ± SD (n=5 separate cell populations examined per treatment).
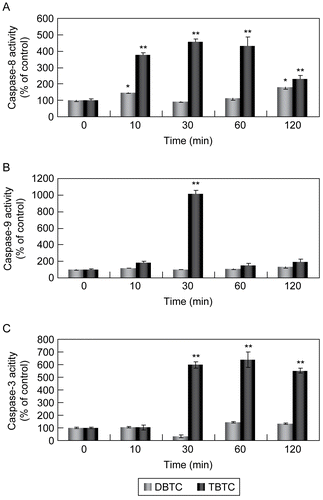
Figure 3.  Activation of caspases during alkyltin-induced cell death. Whole cell lysates (5.0 μg) were prepared from thymocytes exposed to 1 μM DBTC or TBTC for the indicated times. Activation of (A) caspase-8, (B) caspase-9, and (C) caspase-3 was determined using specific fluorescent substrates Ac-IETD-MCA, Ac-LEHD-MCA, and Ac-DMQD-MCA, respectively. Fluorescence was detected using a plate reader. Date are expressed as percentage of values found at 0 hr (control). Results shown are the mean ± SD (n=5 separate cell populations examined per treatment).

Figure 4. Evaluation of time-dependent mitochondrial function. Mitochondrial dehydrogenase activity measured with WST-8 assay after T-lymphocyte exposure to 1 μM DBTC or TBTC for the indicated times. Absorbance was detected using a plate reader. Date are expressed as percentage of values found at 0 hr. Results shown are the mean ± SD (n=5 separate cell populations examined per treatment). Value statistically different (at **p < 0.01or *p < 0.05) compared to the control (0 min; vehicle-treated cells).
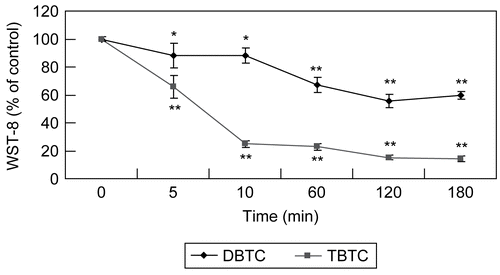
Figure 4.  Evaluation of time-dependent mitochondrial function. Mitochondrial dehydrogenase activity measured with WST-8 assay after T-lymphocyte exposure to 1 μM DBTC or TBTC for the indicated times. Absorbance was detected using a plate reader. Date are expressed as percentage of values found at 0 hr. Results shown are the mean ± SD (n=5 separate cell populations examined per treatment). Value statistically different (at **p < 0.01or *p < 0.05) compared to the control (0 min; vehicle-treated cells).

Figure 5. Analysis of mitochondrial membrane potential. Mitochondrial membrane potential was analyzed using a flow cytometry with JC-1. Red fluorescence intensity indicated cells with stable Δψm, while green fluorescence intensity indicated cells with low Δψm. A shift from red to green denotes dissipation of potential. The cell populations in region designated “A” represented cells that had maintained normal potentials; those in the region designated “B” had a decrease in membrane potential(s).The percentage of mitochondrial membrane potential depolarized cells in region (B) is indicated. While the images shown are a representative cytogram from these assays, the percentage results shown in each are the mean ± SD (n=5 separate cell populations examined per treatment shown).
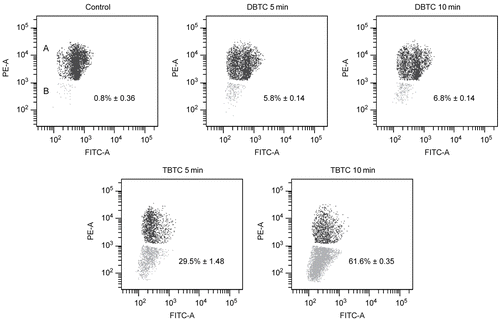
Figure 5.  Analysis of mitochondrial membrane potential. Mitochondrial membrane potential was analyzed using a flow cytometry with JC-1. Red fluorescence intensity indicated cells with stable Δψm, while green fluorescence intensity indicated cells with low Δψm. A shift from red to green denotes dissipation of potential. The cell populations in region designated “A” represented cells that had maintained normal potentials; those in the region designated “B” had a decrease in membrane potential(s).The percentage of mitochondrial membrane potential depolarized cells in region (B) is indicated. While the images shown are a representative cytogram from these assays, the percentage results shown in each are the mean ± SD (n=5 separate cell populations examined per treatment shown).

Figure 6. Western blot analyses of time-dependent changes in cytochrome c. Cytosolic fractions without mitochondria (10 μg/ml) from organotin-exposed T-lymphocytes were separated over an 15% SDS-PAGE gel, and then transferred to PVDF membranes. The membranes were immunoblotted with rabbit polyclonal anti-cytochrome c (1:500), and the signals were detected by use of an ECL system. β-Actin was employed as an internal standard to verify uniformity of protein loading and transfer. (A) Representative immunoblot; each band indicates cytochrome c protein and β-actin protein. (B) Band intensity as determined using Image QuaNT. Results shown are the mean ± SD (n=5 separate cell populations examined per treatment shown).
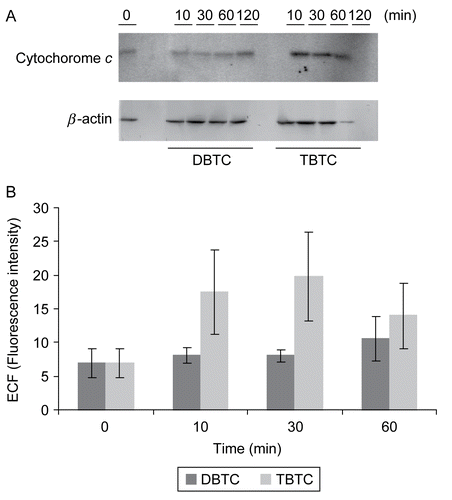
Figure 6.  Western blot analyses of time-dependent changes in cytochrome c. Cytosolic fractions without mitochondria (10 μg/ml) from organotin-exposed T-lymphocytes were separated over an 15% SDS-PAGE gel, and then transferred to PVDF membranes. The membranes were immunoblotted with rabbit polyclonal anti-cytochrome c (1:500), and the signals were detected by use of an ECL system. β-Actin was employed as an internal standard to verify uniformity of protein loading and transfer. (A) Representative immunoblot; each band indicates cytochrome c protein and β-actin protein. (B) Band intensity as determined using Image QuaNT. Results shown are the mean ± SD (n=5 separate cell populations examined per treatment shown).

Figure 7. Expression of CAD and ICAD. Cytosolic fractions (10 μg/ml) from organotin-exposed T-lymphocytes were resolved over a 12% SDS-PAGE gel, then transferred to PVDF membranes. The membranes were then immunoblotted with rabbit polyclonal anti-CAD (1:1000) and anti-ICAD (1:1000), and the signals later detected by use of an ECL system. β-Actin was employed as an internal standard to verify uniformity of protein loading and transfer. (A) Representative immunoblot; each band indicates CAD protein and ICAD protein, respectively. (B) Intensity of each immunoreactive band was estimated using fluorometric quantification. Results shown are the mean ± SD (n=5 separate cell populations examined per treatment shown).
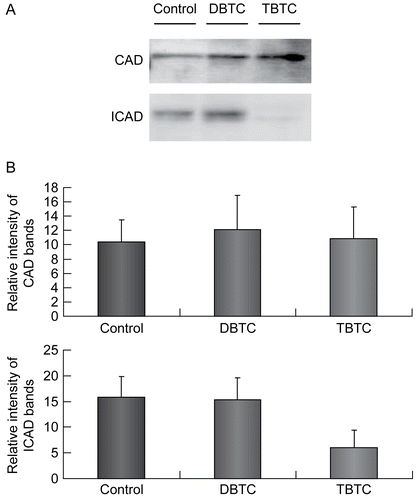
Figure 7.  Expression of CAD and ICAD. Cytosolic fractions (10 μg/ml) from organotin-exposed T-lymphocytes were resolved over a 12% SDS-PAGE gel, then transferred to PVDF membranes. The membranes were then immunoblotted with rabbit polyclonal anti-CAD (1:1000) and anti-ICAD (1:1000), and the signals later detected by use of an ECL system. β-Actin was employed as an internal standard to verify uniformity of protein loading and transfer. (A) Representative immunoblot; each band indicates CAD protein and ICAD protein, respectively. (B) Intensity of each immunoreactive band was estimated using fluorometric quantification. Results shown are the mean ± SD (n=5 separate cell populations examined per treatment shown).

Figure 8. Effect of caspase-8, -9, and/or -3 inhibitors on alkyltin-induced activation of caspases-3 and -8. Cells were pre-treated with vehicle, 50 μM Z-DEVD-FMK (caspase-3 inhibitor), Z-IETD-FMK (caspase-8 inhibitor), or Z-VAD-FMK (caspase-9 inhibitor) 30 min prior to the challenge with 1 μM TBTC. One hour after the treatment with TBTC (or DBTC for comparative purposes) was begun, (A) caspase-3 and (B) caspase-8 activities were determined using a plate reader. Results shown are the activities as percent of time-matched control values; mean ±SD (n=5 separate cell populations examined per treatment shown). Value statistically different at **p < 0.01 compared to control and/or at ##p < 0.01 compared to TBTC- only treated cells.
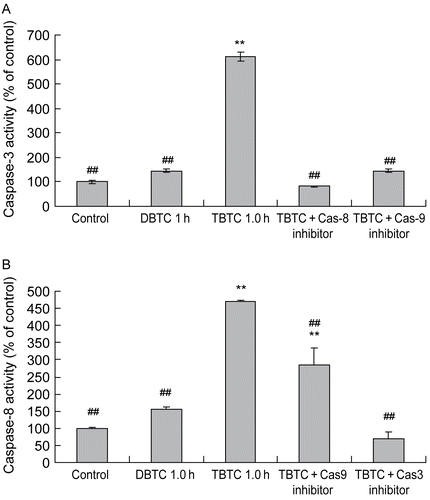
Figure 8.  Effect of caspase-8, -9, and/or -3 inhibitors on alkyltin-induced activation of caspases-3 and -8. Cells were pre-treated with vehicle, 50 μM Z-DEVD-FMK (caspase-3 inhibitor), Z-IETD-FMK (caspase-8 inhibitor), or Z-VAD-FMK (caspase-9 inhibitor) 30 min prior to the challenge with 1 μM TBTC. One hour after the treatment with TBTC (or DBTC for comparative purposes) was begun, (A) caspase-3 and (B) caspase-8 activities were determined using a plate reader. Results shown are the activities as percent of time-matched control values; mean ±SD (n=5 separate cell populations examined per treatment shown). Value statistically different at **p < 0.01 compared to control and/or at ##p < 0.01 compared to TBTC- only treated cells.

Reprints and Corporate Permissions

Please note: Selecting permissions does not provide access to the full text of the article, please see our help page How do I view content?

To request a reprint or corporate permissions for this article, please click on the relevant link below:

Academic Permissions

Please note: Selecting permissions does not provide access to the full text of the article, please see our help page How do I view content?

Obtain permissions instantly via Rightslink by clicking on the button below:

If you are unable to obtain permissions via Rightslink, please complete and submit this Permissions form. For more information, please visit our Permissions help page.