787
Views
16
CrossRef citations to date
0
Altmetric
Research Article

Expression of constitutively-active aryl hydrocarbon receptor in T-cells enhances the down-regulation of CD62L, but does not alter expression of CD25 or suppress the allogeneic CTL response

, , , , , , & show all
Pages 194-203 | Received 02 Apr 2009, Accepted 17 Jun 2009, Published online: 27 Jul 2009

Figures & data

Figure 1. CA-AhR does not alter the number or proliferation of donor T-cells in the spleen on Day 2. Age- and gender-matched F1 mice were dosed with vehicle or 20 μg/kg TCDD one day before the injection of donor T-cells from B6-WT or CA-AhR mice. On Day 2 after injection of donor T-cells, the spleens from F1 mice were collected and analyzed by flow cytometry. After gating on total spleen cells (A), the donor T-cells were identified as CFSE+CD4+ (B) or CFSE+CD8+ (C). For A-C, data are combined from two independent experiments and n = 4-6 mice per group. VEH, vehicle-treated F1 recipient; TCDD, TCDD-treated F1 recipient; SYN, syngeneic B6 recipient; WT, donor T-cells from wild-type mice; CA, donor T-cells from CA-AhR Tg mice. The percentage of donor CD4+ (D) or CD8+ T-cells (E) that were dividing was determined on Day 2. Representative histograms are shown and the numbers on the histograms indicate the mean ± SEM of the percentage of cells in divisions 1-4 for n = 3 mice per group. *Indicates statistically significant difference compared to VEH-WT; +indicates statistically significant difference compared to TCDD-WT.
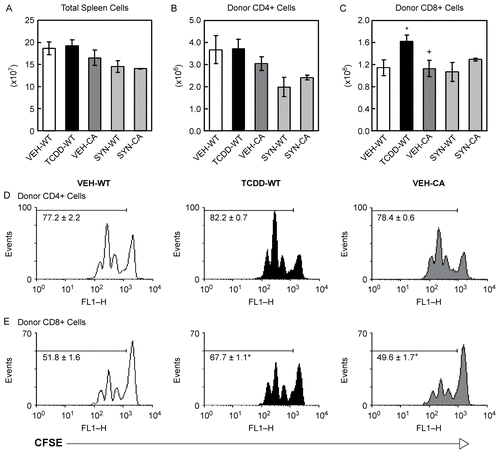
Figure 1.  CA-AhR does not alter the number or proliferation of donor T-cells in the spleen on Day 2. Age- and gender-matched F1 mice were dosed with vehicle or 20 μg/kg TCDD one day before the injection of donor T-cells from B6-WT or CA-AhR mice. On Day 2 after injection of donor T-cells, the spleens from F1 mice were collected and analyzed by flow cytometry. After gating on total spleen cells (A), the donor T-cells were identified as CFSE+CD4+ (B) or CFSE+CD8+ (C). For A-C, data are combined from two independent experiments and n = 4-6 mice per group. VEH, vehicle-treated F1 recipient; TCDD, TCDD-treated F1 recipient; SYN, syngeneic B6 recipient; WT, donor T-cells from wild-type mice; CA, donor T-cells from CA-AhR Tg mice. The percentage of donor CD4+ (D) or CD8+ T-cells (E) that were dividing was determined on Day 2. Representative histograms are shown and the numbers on the histograms indicate the mean ± SEM of the percentage of cells in divisions 1-4 for n = 3 mice per group. *Indicates statistically significant difference compared to VEH-WT; +indicates statistically significant difference compared to TCDD-WT.

Figure 2. CA-AhR enhances the down-regulation of CD62L comparable to TCDD but has only a minimal effect on the up-regulation of CD25. F1 mice were treated with vehicle or TCDD as described for . On Day 2, the donor CD4+ (A and C) and donor CD8+ T-cells (B and D) were analyzed for the expression of CD25 (A and B) and CD62L (C and D). For CD25, data are combined from two independent experiments with n = 4–6 mice per group. For CD62L, data are from a representative experiment with n = 3–4 mice per group. Also on Day 2, the median fluorescence intensity (MedFI) of CD62L was determined for each cell division for donor CD4+ (E) and CD8+ (F) T-cells. *Indicates statistically significant difference compared to VEH-WT; +indicates statistically significant difference compared to TCDD-WT; #indicates statistically significant difference compared to SYN-WT.
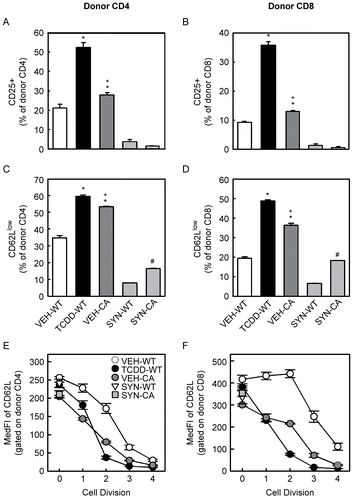
Figure 2.  CA-AhR enhances the down-regulation of CD62L comparable to TCDD but has only a minimal effect on the up-regulation of CD25. F1 mice were treated with vehicle or TCDD as described for Figure 1. On Day 2, the donor CD4+ (A and C) and donor CD8+ T-cells (B and D) were analyzed for the expression of CD25 (A and B) and CD62L (C and D). For CD25, data are combined from two independent experiments with n = 4–6 mice per group. For CD62L, data are from a representative experiment with n = 3–4 mice per group. Also on Day 2, the median fluorescence intensity (MedFI) of CD62L was determined for each cell division for donor CD4+ (E) and CD8+ (F) T-cells. *Indicates statistically significant difference compared to VEH-WT; +indicates statistically significant difference compared to TCDD-WT; #indicates statistically significant difference compared to SYN-WT.

Figure 3. CA-AhR does not expand a subpopulation of CD25hiCD62Llow donor T-cells. F1 mice were treated with vehicle or TCDD as described for . The co-expression of CD25 and CD62L was determined for the donor CD4+ (A) and donor CD8+ T-cells (B) on Day 2. Representative histograms are shown and the numbers on the histograms indicate the mean of the percentage of cells in each quadrant for n = 3 mice per group (SEM is excluded for clarity). *Indicates statistically significant difference compared to VEH-WT; +indicates statistically significant difference compared to TCDD-WT.
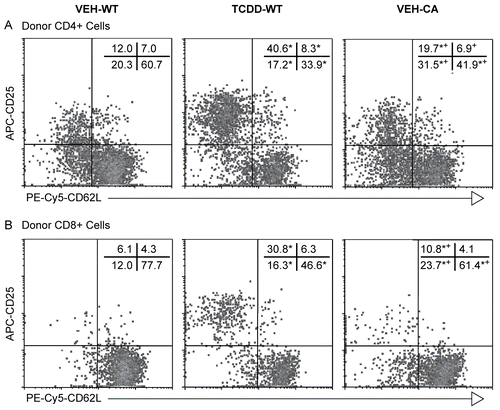
Figure 3.  CA-AhR does not expand a subpopulation of CD25hiCD62Llow donor T-cells. F1 mice were treated with vehicle or TCDD as described for Figure 1. The co-expression of CD25 and CD62L was determined for the donor CD4+ (A) and donor CD8+ T-cells (B) on Day 2. Representative histograms are shown and the numbers on the histograms indicate the mean of the percentage of cells in each quadrant for n = 3 mice per group (SEM is excluded for clarity). *Indicates statistically significant difference compared to VEH-WT; +indicates statistically significant difference compared to TCDD-WT.
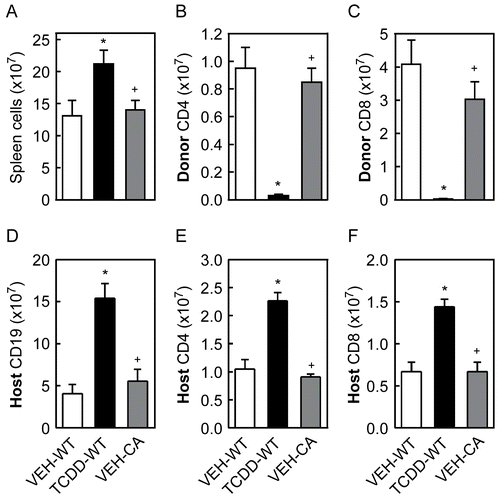
Figure 4. Analysis of the distribution of spleen cells on Day 10 after injection of donor T-cells. F1 mice were treated with vehicle or TCDD as described for . On Day 10 after injection of donor T-cells, total spleen cells from F1 mice were counted (A) and analyzed by flow cytometry for enumeration of donor CD4+ (B) and donor CD8+ T-cells (C), host CD19+ cells (D), host CD4+ (E) and host CD8+ T-cells (F). Data from a representative experiment are shown with n = 4-5 mice per group. *Indicates statistically significant difference compared to VEH-WT; +indicates statistically significant difference compared to TCDD-WT.
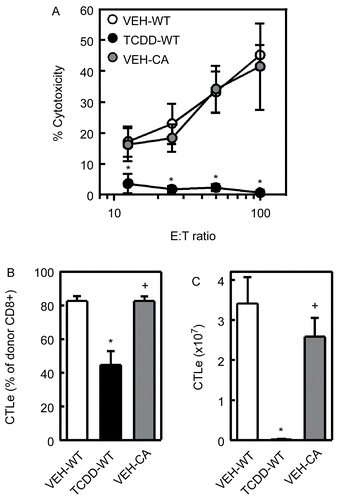
Figure 4.  Analysis of the distribution of spleen cells on Day 10 after injection of donor T-cells. F1 mice were treated with vehicle or TCDD as described for Figure 1. On Day 10 after injection of donor T-cells, total spleen cells from F1 mice were counted (A) and analyzed by flow cytometry for enumeration of donor CD4+ (B) and donor CD8+ T-cells (C), host CD19+ cells (D), host CD4+ (E) and host CD8+ T-cells (F). Data from a representative experiment are shown with n = 4-5 mice per group. *Indicates statistically significant difference compared to VEH-WT; +indicates statistically significant difference compared to TCDD-WT.

Figure 5. CA-AhR does not suppress the CTL activity or the percentage and number of CTL effectors in the spleen on Day 10. F1 mice were treated with vehicle or TCDD as described for . Ten days after in the injection of donor T-cells, the spleen cells from F1 mice were tested for CTL activity using a non-radioactive cytotoxicity assay, as described in the Methods (A). The percentage (B) of donor CD8+ cells, identified as Thy1.1+CD8+ cells, expressing a CTL effector (CTLe) phenotype, defined as CD44hiCD62Llow, and the number (C) of CTLe in the spleen were determined by flow cytometry. Data from a representative experiment are shown with n = 4–5 mice per group. *Indicates statistically significant difference compared to VEH-WT; +indicates statistically significant difference compared to TCDD-WT.

Figure 5.  CA-AhR does not suppress the CTL activity or the percentage and number of CTL effectors in the spleen on Day 10. F1 mice were treated with vehicle or TCDD as described for figure 1. Ten days after in the injection of donor T-cells, the spleen cells from F1 mice were tested for CTL activity using a non-radioactive cytotoxicity assay, as described in the Methods (A). The percentage (B) of donor CD8+ cells, identified as Thy1.1+CD8+ cells, expressing a CTL effector (CTLe) phenotype, defined as CD44hiCD62Llow, and the number (C) of CTLe in the spleen were determined by flow cytometry. Data from a representative experiment are shown with n = 4–5 mice per group. *Indicates statistically significant difference compared to VEH-WT; +indicates statistically significant difference compared to TCDD-WT.

Figure 6. Host AhR does not appear to be involved in suppression of the CTL response on Day 10. (A) KO-F1 and WT-F1 mice were dosed with 0, 3, 15, or 30 μg TCDD/kg body weight and, two days later, the livers were collected and EROD activity was determined as described in the Methods. (B) KO- and WT-F1 mice received AhR-WT donor T-cells and treated with 15 μg TCDD/kg body weight. Ten days later, the CTL activity in the spleen was assessed. Data from a representative experiment are shown.
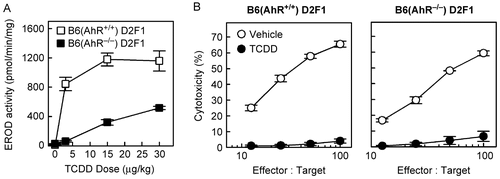
Figure 6.  Host AhR does not appear to be involved in suppression of the CTL response on Day 10. (A) KO-F1 and WT-F1 mice were dosed with 0, 3, 15, or 30 μg TCDD/kg body weight and, two days later, the livers were collected and EROD activity was determined as described in the Methods. (B) KO- and WT-F1 mice received AhR-WT donor T-cells and treated with 15 μg TCDD/kg body weight. Ten days later, the CTL activity in the spleen was assessed. Data from a representative experiment are shown.

Reprints and Corporate Permissions

Please note: Selecting permissions does not provide access to the full text of the article, please see our help page How do I view content?

To request a reprint or corporate permissions for this article, please click on the relevant link below:

Academic Permissions

Please note: Selecting permissions does not provide access to the full text of the article, please see our help page How do I view content?

Obtain permissions instantly via Rightslink by clicking on the button below:

If you are unable to obtain permissions via Rightslink, please complete and submit this Permissions form. For more information, please visit our Permissions help page.