Figures & data
Figure 1. Effect of V2O5 on PI3K subunits. Histogram depicting the results obtained with NK92-MI cells exposed to different V2O5 concentrations (25–400 µM) of V2O5 during 24 h upon PI3K regulatory p85 and catalytic p110α subunits and phospho-PI3K p85–p55. The results show the single labeling cell assays. The dashed line shows the basal MFI at 0 μM. *p < 0.05, **p < 0.01, ***p < 0.001 versus 0 μM of V2O5.
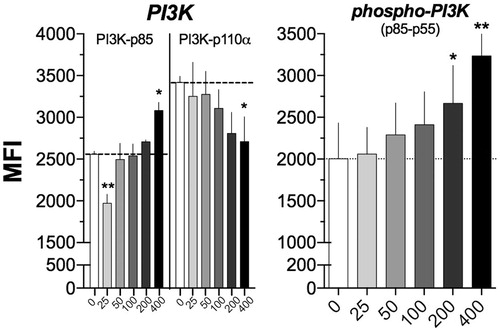
Figure 2. Effect of V2O5 on AKT/mTOR. Histogram depicting the effect of vanadium pentoxide on the activation of AKT/mTOR by flow cytometry in NK92-MI cells exposed to different concentrations (25–400 µM) of V2O5 during 24 h. (A) AKT and phospho-AKT. (B) mTOR and phosphorus-mTOR. Results are expressed as MFI from the single-labeling cell assays. The dashed line shows the basal MFI at 0 μM (basal). *p < 0.05, **p < 0.01, ***p < 0.001 versus control (basal).
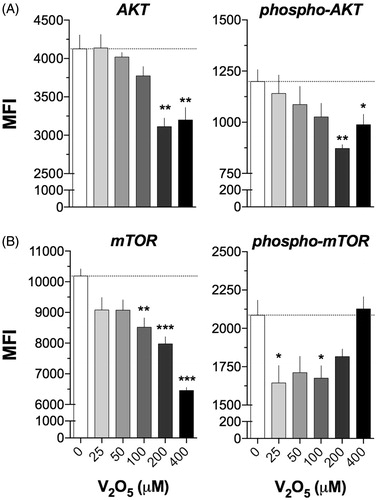
Figure 3. Effect of V2O5 on protein kinases and phosphorylation states. NK-92MI cells were treated with 0–400 V2O5 for 24 h. Double staining with antibodies to the following molecules was performed: (A) AKT versus pAKT-Ser473 [lower left quadrant represents negative cells for both parameters (AKT-/AKT-Ser473-), upper left quadrant represents AKT+, upper right quadrant represents positive cells for both parameters (AKT+/AKT-Ser473+), lower right quadrant represents positive cells only for (AKT-Ser473+)], zebra plots come from previous regions which are shown in the upper right of this figure and using the same analysis strategy for (B) mTOR versus mTOR (Ser2448). Data in each quadrant are presented in percentages and defined according to isotype controls for each antibody used. Right-side dot-plots represent example of analysis strategy used to generate zebra plots in A and B. Results exemplify one of three independent experiments performed with each V2O5 concentrations.
![Figure 3. Effect of V2O5 on protein kinases and phosphorylation states. NK-92MI cells were treated with 0–400 V2O5 for 24 h. Double staining with antibodies to the following molecules was performed: (A) AKT versus pAKT-Ser473 [lower left quadrant represents negative cells for both parameters (AKT-/AKT-Ser473-), upper left quadrant represents AKT+, upper right quadrant represents positive cells for both parameters (AKT+/AKT-Ser473+), lower right quadrant represents positive cells only for (AKT-Ser473+)], zebra plots come from previous regions which are shown in the upper right of this figure and using the same analysis strategy for (B) mTOR versus mTOR (Ser2448). Data in each quadrant are presented in percentages and defined according to isotype controls for each antibody used. Right-side dot-plots represent example of analysis strategy used to generate zebra plots in A and B. Results exemplify one of three independent experiments performed with each V2O5 concentrations.](/cms/asset/15e01a36-2650-419e-b2c6-d366e7e30eb0/iimt_a_1404662_f0003_b.jpg)
Figure 4. Activation of MEK and ERK1/2 in V2O5-treated (24 h) NK-92MI cells. Flow cytometry was performed on cells exposed to 0–400 µM V2O5. (A) MEK1 and p-MEK-1/2. (B) ERK-1/2 and p-p44/42 MAPK (ERK1/2). Results are expressed as MFI. Dashed line shows basal MFI (0 μM). Results are for single labeling cell assays. *p < 0.05 versus control (basal).
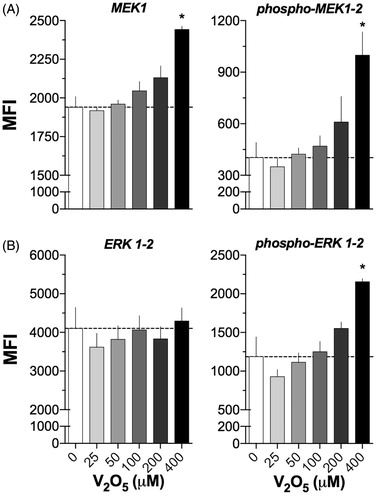
Figure 5. Protein kinases/phosphorylation states in V2O5-treated (24 h) NK-92MI cells. Flow cytometry was performed on cells exposed to 0–400 µM V2O5. Double staining with antibodies to the following was performed: (A) MEK-1 versus ERK-1/2 (Thr202/Tyr204) and (B) MEK1/2 (Ser218/Ser222) versus ERK- 1/2 (Thr202/Tyr204). Data in each zebra plot quadrant are presented as percentages and defined according to isotype controls for each antibody used. Results exemplify one of three independent experiments performed with each V2O5 level.
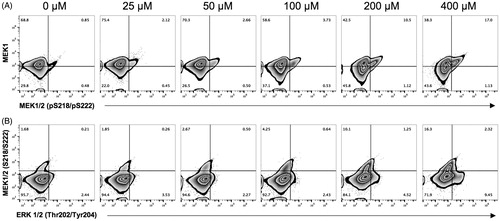
Figure 6. PTEN, SHP1 and phosphorylated forms expression in V2O5-treated (24 h) NK-92MI cells. Flow cytometry was performed on cells exposed to 0–400 µM V2O5. A and B: results of single labeling cell assays. C and D: PTEN and SHP1 and phosphorylated forms on cells. Data in each zebra plot quadrant are presented as percentages and quadrants were defined according to isotype controls for each antibody used. Results exemplify one of three independent experiments performed with each V2O5 level. Dashed line represents basal MFI (0 μM). *p < 0.05, **p < 0.01 versus control (basal).
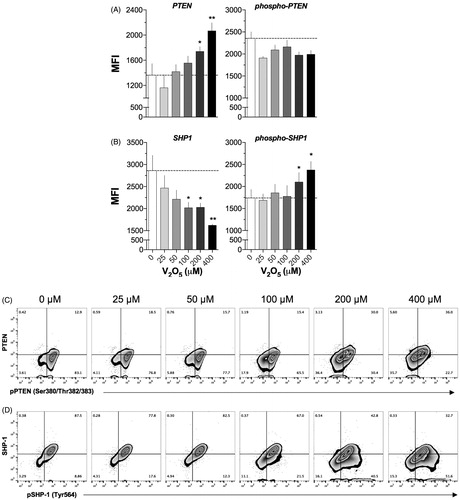
Figure 7. PTEN and phosphorylated PTEN expression in NK cells treated with V2O5 for 24 h. Confocal microscopy images of cells sorted by cytometer. (A, C) Non-stimulated cells. (B, D) Cells treated with 400 µM V2O5. Nucleic acid staining with DAPI (green). Arrows in C indicate membrane location of pPTEN, which is lost in cells exposed to V2O5. Magnification = 60×.
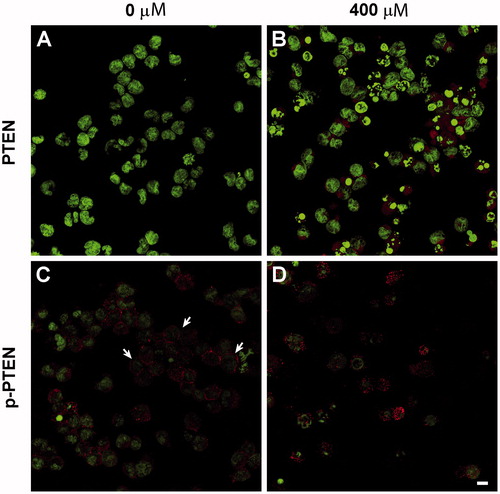
Figure 8. Pro-apoptotic molecule expression in V2O5-treated (24 h) NK-92MI cells. Analyses performed after exposure to different concentrations (25–400 µM) of V2O5. Top figure shows results on simple labeling cell assays; lower figure shows behavior of both molecules on cells. (A) BAD and p-BAD (Ser112), (B) BAK and BAX. Data in each quadrant of zebra plots (C, D) are presented as percentages. Quadrants were defined according to isotype controls for each antibody used. Results exemplify one of three independent experiments performed with each V2O5 level. Dashed line shows basal MFI at 0 μM. *p < 0.05, **p < 0.01 versus control (basal).
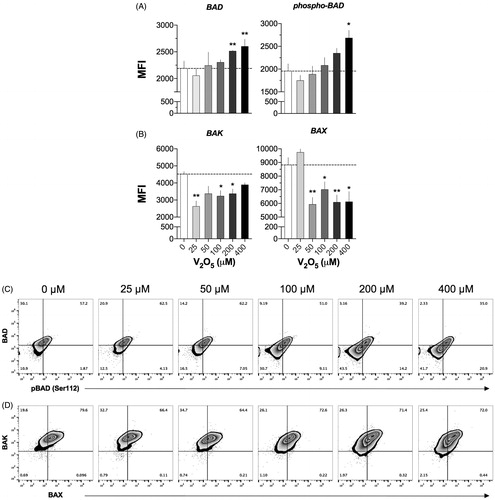
Figure 9. Caspases expression in V2O5-treated (24 h) NK-92MI cells. (A) Cleaved caspase-8 (Asp391); (B) caspase-9; and, (C) cleaved caspase-3 (Asp175). Results represent percentage of positive cells in relation to respective isotype control. (D) Analysis strategy of cytofluorometry data. The image represents data obtained when caspase-9 expression was evaluated in 100 µM V2O5-treated cells. All data was analyzed following this dot plot strategy.
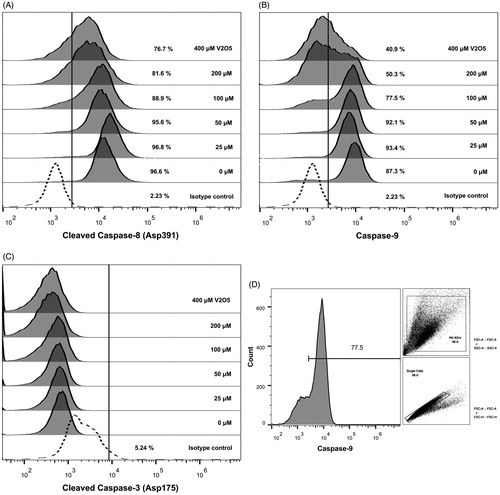
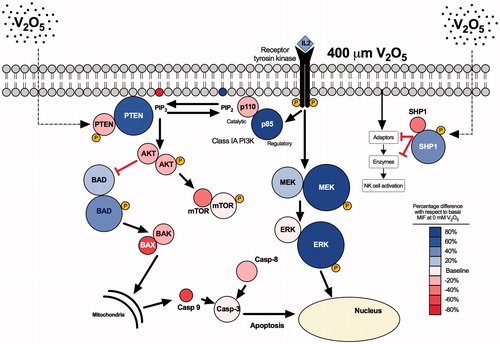
Figure 10. Schematic representation of V2O5-induced toxicity. Image shows how V2O5 might modify expression of the molecules (expression gradated by color) in relation to basal expression in non-treated NK-92MI cells. The main effect of V2O5 was upon SHP1 and PTEN phosphatases, both of which regulate signaling pathways depicted in the diagram.