Figures & data
Figure 1. Viability of human macrophages after treating with BPA at different concentrations and for different durations (n = 5, mean ± SD). **p < 0.01 vs. 0 µM.
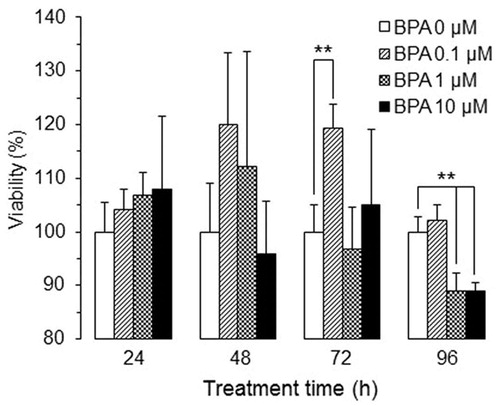
Figure 2. Viability of human macrophages after treating with bisphenols at different concentrations for 48 h (n = 4, mean ± SD). **p < 0.01 vs. 0 µM; abp < 0.05 among bisphenols.
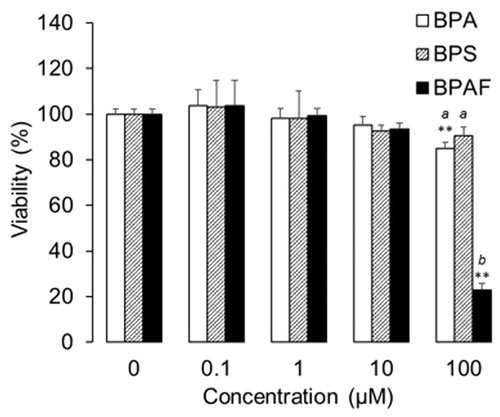
Figure 3. Heat-map of cytokine/chemokine profiles modulated by bisphenols. Numbers in the control line indicate cytokine/chemokine levels (pg/ml).
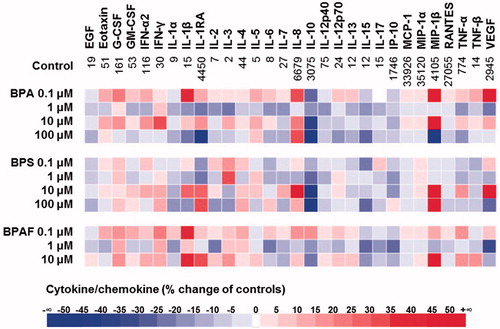
Figure 4. Analysis of cytokine/chemokine data regulated by bisphenols. (A, C, E, G) Differences among BPA, BPS, and BPAF effects on cytokine/chemokine modulation were analyzed using PCA by comparing to the control. (B, D, F, H) Cytokines/chemokines altered by >20%.
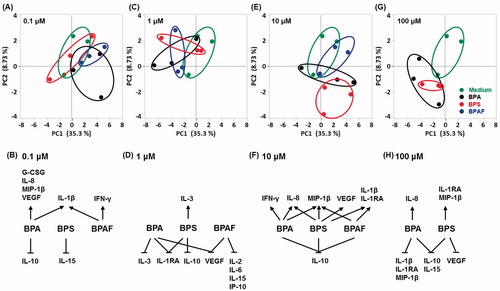
Figure 5. Viability of human macrophages after treating with BPA and/or genistein (GEN) at different concentrations and for different durations (n = 5, mean ± SD). *p < 0.05, **p < 0.01 vs. GEN (0 µM).
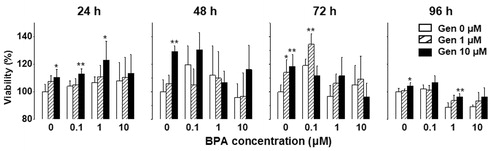
Figure 6. Heat-map of cytokine/chemokine profiles modulated by BPA and/or GEN. Numbers in the BPA (0 µM) GEN (0 µM) indicate cytokine/chemokine levels (pg/ml).
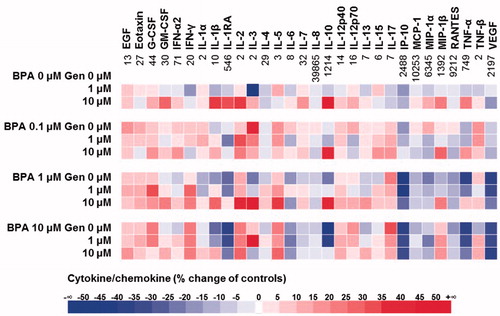
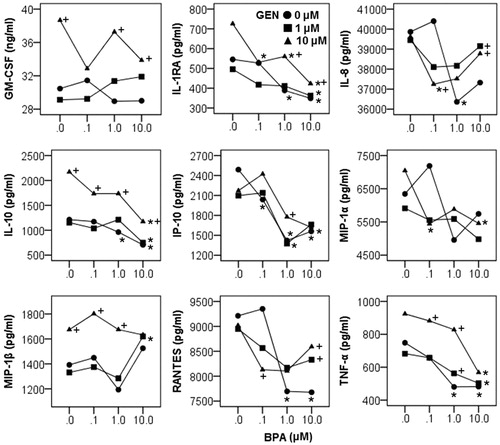
Figure 7. Effect of BPA and GEN on cytokine/chemokine expression. Significant interactions between BPA and GEN were detected on cytokines (GM-CSF, IL-1RA, IL-10, and TNFα) and chemokines (IL-8, IP-10, MIP-1α, MIP-1β, and RANTES). *p < 0.05 vs 0 µM BPA at same GEN level, +p < 0.05 vs 0 µM GEN at same BPA level.