
Figures & data
Figure 1. Effects of streptolysin O toxin (SOT) on ROS production and elastase release by PMN alone or by cells activated with N-formyl-l-methionyl-l-leucyl-l-phenylalanine (fMLP, 0.1 µM) (unshaded columns), or with the combination of fMLP/cytochalasin B (1 µM) (shaded column). Background (BG) refers to unstimulated control. Results are expressed as means ± SD (n = 5). *p < 0.0007; +p < 0.0001).
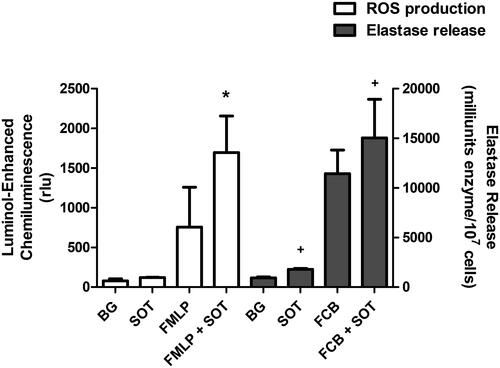
Figure 2. (A) Effects of streptolysin O toxin (SOT) on the influx of Ca2+ into Fura-2/AM-loaded PMN. Representative traces from a single experiment are shown (n = 6 in the series). SOT added (↓) to PMN suspended in Ca2+-replete medium resulted in a sustained increase in Fura-2 fluorescence following a short lag phase. (B) Mean increases in the fluorescence intensity of PMN loaded with Fura-2/AM following treatment with SOT. Background (BG) refers to the corresponding values for resting cells (in the absence of SOT). Results are expressed as mean MFU ± SD (n = 6). *p < 0.004.
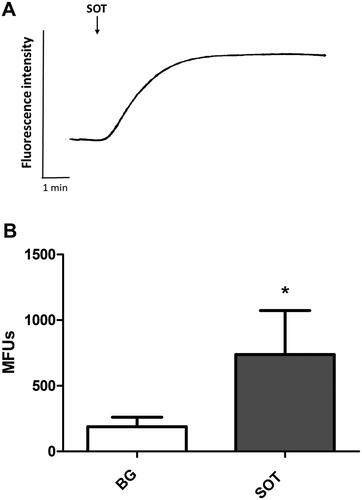
Figure 3. (A) Effects of pneumolysin (PLY) on influx of Ca2+ into fluo-8/AM-loaded PMN in the presence (a), or absence (B) of EGTA. Representative traces from a single experiment are shown. PLY added (↓) to PMN suspended in Ca2+-replete medium resulted in a sustained increase in fluo-8 fluorescence, while Ca2+ influx peaked rapidly and returned to near basal levels in the presence of EGTA.
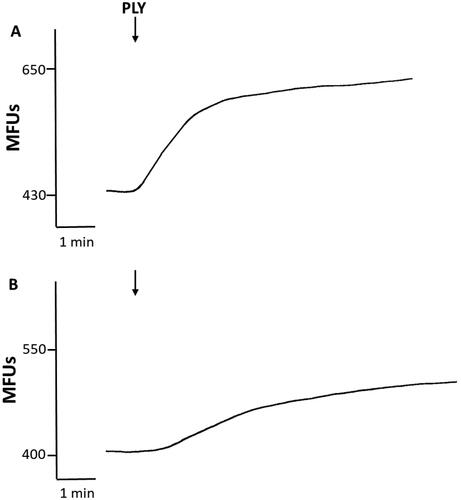
Figure 4. (A) Effects of calcium ionophore (CaI) on influx of Ca2+ into fluo-8/AM-loaded PMN in the presence (a), or absence (B) of EGTA. Representative traces from a single experiment are shown. CaI added (↓) to PMN suspended in Ca2+-replete medium resulted in a sustained increase in fluo-8 fluorescence, while Ca2+ influx peaked rapidly and returned to basal levels in the presence of EGTA.
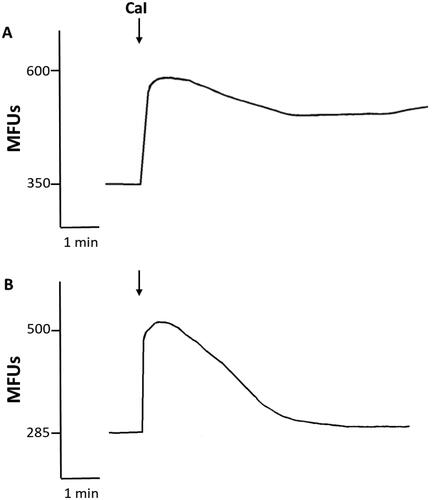
Table 1. Effects of streptolysin O toxin (80 ng/mL) on release of extracellular DNA by PMN in presence of toxin or PMA (6.25 mg/mL).
Data availability statement
Data can be made available upon reasonable request.