
Figures & data
Figure 1. Effect of condition on death-thought accessibility for Study 1.
Note. Mortality salience increases death-thought accessibility relative to ostracism and control. Error bars represent standard errors.
Figure 2. Mean need satisfaction by condition for Study 1.
Note. Ostracized participants reported decreased need satisfaction compared to control and mortality salience participants. Error bars represent standard errors.
Figure 3. Instructions for Cybergrave.
Note. The image above depicts the instructions for Cybergrave. This is the first screen participants are shown when they begin the task.
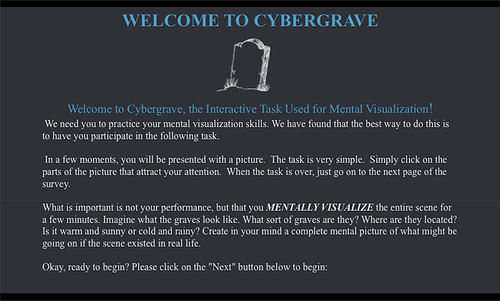
Figure 4. Cybergrave mortality salience manipulation.
Note. The imagine above depicts the Cybergrave mortality salience manipulation. When participants click around the screen a dot appears on the location they click on.
Figure 5. Mean death-thought accessibility by condition for Study 2.
Note. Mortality salience increases death-thought accessibility relative to ostracism and inclusion. Error bars represent standard errors.
Figure 6. Mean support for killing animals by condition for Study 2.
Note. Mortality salience increases support for killing animals compared to ostracism, but not compared to inclusion. The means depicted were calculated with the manipulation check failures filtered out. Error bars represent standard errors.
Figure 7. Mean need satisfaction by condition for Study 2.
Note. The means depicted here were calculated with manipulation check failures filtered out. Error bars represent standard errors.
Table 1. Post hoc comparisons of death-thought accessibility by condition for studies 3a and 3b.
Table 2. Post hoc comparisons of need satisfaction by condition for studies 3a and 3b.
Table 3. Post hoc comparisons of negative mood by condition for studies 3a and 3b.
Table 4. Correlation matrix for study 4.
Supplemental material