Figures & data
Figure 1. Schematic overview of autophagy regulation by exercise, hormonal, and nutrient signals. Arrow-headed (green) lines and bar-headed (red) lines indicate activation and inhibition, respectively.
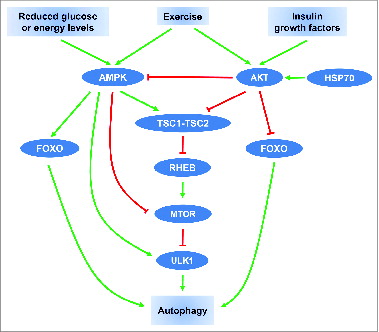
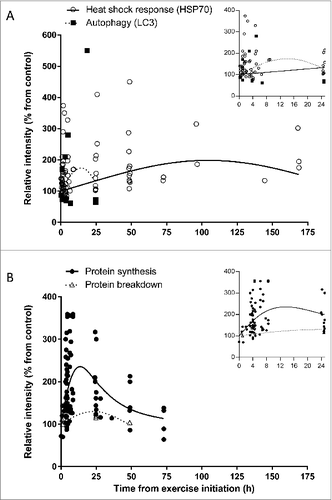
Figure 2. Time-course effect of acute exercise on (A) heat shock response (HSP70) and autophagy (LC3), and (B) protein synthesis and protein breakdown in humans based on acute exercise trials listed in Tables S1-4. Each dot represents 1 measurement. In both panels (A and B) the X-axis represents the time from the start of exercise, that is the sum of times in hours representing duration of exercise and collection time post-exercise; in panel (A), the Y-axis represents relative intensity of HSP70 protein expression (Table S1) or LC3 protein expression (Table S2); in panel (B), the Y-axis represents relative intensity of protein synthesis (Table S3) or protein breakdown (Table S4). (Insets) Expanded views of the first 25-h time point. Axes titles removed for clarity. The X-axis represents time from the start of exercise in hours, and the Y-axis represents relative intensity (% from control). In the (A) inset the Y-axis scale was truncated to improve clarity.