3,671
Views
81
CrossRef citations to date
0
Altmetric
Basic Research Paper

The marine n-3 PUFA DHA evokes cytoprotection against oxidative stress and protein misfolding by inducing autophagy and NFE2L2 in human retinal pigment epithelial cells

, , , , , , & show all
Pages 1636-1651 | Received 07 Oct 2014, Accepted 05 Jun 2015, Published online: 18 Sep 2015

Figures & data

Figure 1. The n-3 PUFA DHA increases protein level of SQSTM1 and induces autophagy in ARPE-19 cells. (A) Cells were treated with DHA (70 µM) for 24 h and lysed in Triton X-100 (Tx100) buffer. Equal amounts of protein (20 µg) from T × 100 fraction were centrifugated at 10,000 x g and the pellet was dissolved in the same volume of 8 M urea buffer before loading on the gel. The membrane was immunoblotted for SQSTM1 and MAP1LC3B. β-actin (ACTB) and PCNA are used as loading controls. (B) The cells were treated with DHA, OA or AA (70 µM) with or without BafA1 (100 nM) for 16 h. Total cell extracts were immunoblotted for SQSTM1. ACTB and PCNA are used as loading controls. (C) Protein levels of SQSTM1 and MAP1LC3B determined by immunoblotting of cells treated with DHA (70 µM), BafA1 (100 nM) or a combination of DHA and BafA1 for the indicated time points. The numbers below the MAP1LC3B-II bands represent fold change relative to BafA1 for each time point normalized to PCNA intensity. ACTB and PCNA are used as loading controls. (D) The mRNA levels of SQSTM1, MAP1LC3B, MAP1LC3A, and GABARAPL1 relative to ACTB after DHA (70 and 140 µM) supplementation for 16 h determined by quantitative real-time PCR. qRT-PCR data displayed are representative for 2 independent experiments. Mean fold change from triplicate wells ± SD is displayed. Data shown are representative of 3 or more independent experiments, unless otherwise stated.
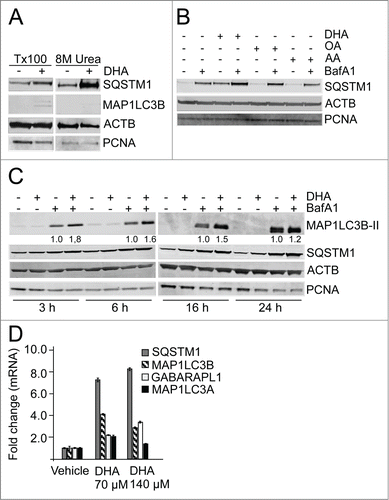
Figure 1. The n-3 PUFA DHA increases protein level of SQSTM1 and induces autophagy in ARPE-19 cells. (A) Cells were treated with DHA (70 µM) for 24 h and lysed in Triton X-100 (Tx100) buffer. Equal amounts of protein (20 µg) from T × 100 fraction were centrifugated at 10,000 x g and the pellet was dissolved in the same volume of 8 M urea buffer before loading on the gel. The membrane was immunoblotted for SQSTM1 and MAP1LC3B. β-actin (ACTB) and PCNA are used as loading controls. (B) The cells were treated with DHA, OA or AA (70 µM) with or without BafA1 (100 nM) for 16 h. Total cell extracts were immunoblotted for SQSTM1. ACTB and PCNA are used as loading controls. (C) Protein levels of SQSTM1 and MAP1LC3B determined by immunoblotting of cells treated with DHA (70 µM), BafA1 (100 nM) or a combination of DHA and BafA1 for the indicated time points. The numbers below the MAP1LC3B-II bands represent fold change relative to BafA1 for each time point normalized to PCNA intensity. ACTB and PCNA are used as loading controls. (D) The mRNA levels of SQSTM1, MAP1LC3B, MAP1LC3A, and GABARAPL1 relative to ACTB after DHA (70 and 140 µM) supplementation for 16 h determined by quantitative real-time PCR. qRT-PCR data displayed are representative for 2 independent experiments. Mean fold change from triplicate wells ± SD is displayed. Data shown are representative of 3 or more independent experiments, unless otherwise stated.

Figure 2. The number of SQSTM1-positive protein speckles in ARPE-19 cells increases after DHA supplementation. (A) Immunostaining for SQSTM1 and MAP1LC3B after DHA (70 µM) treatment for indicated time points. Nuclear DNA was stained using Draq5 (5 µM). Scale bar: 10 µm. (B) Cells were treated with vehicle (V) or DHA (70 µM) for 1, 3, and 6 h. The SQSTM1-positive speckles were automatically quantified using ScanR automated image acquisition. The quantification displayed are representative for 3 independent experiments from where 2 are automatically quantified for more than 1,000 cells per condition and one is manually counted. *) indicates significantly different from control, Student t test P < 0.05. (C) The number of SQSTM1-positive speckles per cell (upper panel) and SQSTM1 speckles positive for MAP1LC3B (lower panel) in ARPE-19 cells supplemented with vehicle (V) or DHA (70 µM) for the indicated time points. The quantification displayed was performed manually for more than 100 cells per condition from one representative experiment. This quantification is representative for 3 independent experiments.
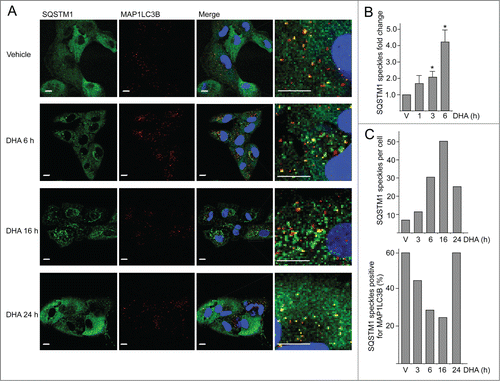
Figure 2. The number of SQSTM1-positive protein speckles in ARPE-19 cells increases after DHA supplementation. (A) Immunostaining for SQSTM1 and MAP1LC3B after DHA (70 µM) treatment for indicated time points. Nuclear DNA was stained using Draq5 (5 µM). Scale bar: 10 µm. (B) Cells were treated with vehicle (V) or DHA (70 µM) for 1, 3, and 6 h. The SQSTM1-positive speckles were automatically quantified using ScanR automated image acquisition. The quantification displayed are representative for 3 independent experiments from where 2 are automatically quantified for more than 1,000 cells per condition and one is manually counted. *) indicates significantly different from control, Student t test P < 0.05. (C) The number of SQSTM1-positive speckles per cell (upper panel) and SQSTM1 speckles positive for MAP1LC3B (lower panel) in ARPE-19 cells supplemented with vehicle (V) or DHA (70 µM) for the indicated time points. The quantification displayed was performed manually for more than 100 cells per condition from one representative experiment. This quantification is representative for 3 independent experiments.

Figure 3. DHA induces a transient increase in ROS and induce NFE2L2 cytoprotective genes. (A) Changes in ROS levels measured at different time points after DHA (70 and 140 µM) using a fluorescent ROS DCF probe. The data represent the mean fold change ± SD for 6 independent experiments for 3 h and 3 independent experiments for 6 h and 24 h. Each experiment was performed in duplicates where the mean intensity of 10,000 cells per well ± SD was measured. *) indicates significantly different from control, Student t test P < 0.05 and **) P < 0.01. (B) Where indicated the cells were pretreated with antioxidants (5 mM N-acetyl-cysteine (NAC) or 150 µM vitamin E) for 16 h before further stimulations with 140 µM DHA for 3 h. The data represent the average of 3 independent experiments for the DHA and NAC treatments and the average of 2 independent experiments for the Vitamin E treatment. Each experiment was performed in duplicates where the mean intensity of 10,000 cells per well ±SD was measured. **) indicates significantly different from DHA, Student t test P < 0.01. (C) Changes in ROS levels measured 3 h after DHA, OA or AA (140 µM) supplementation using a DCF fluorescent probe. The data represent the average of 3 independent experiments ±SD for DHA treated samples and 2 independent experiments ±SD for AA and OA treated samples. Each experiment was performed in duplicates where the mean intensity of 10,000 cells ±SD per well was measured. (D) Immunostaining of NFE2L2 after 70 µM DHA, OA, AA for 6 h. Nuclear DNA was stained using Draq5 (5 µM). Scale bar: 10 µm. The results are representative for 3 independent experiments. Nuclear NFE2L2 staining from one representative experiment was automatically quantified using ScanR automated image acquisition of more than 3,000 cells. Each experiment was performed in duplicates and the data are presented as average percentage number of cells with NFE2L2 nuclear staining ± SD. (E) The cells were pretreated with NAC (5 mM) for 1 h prior to further stimulation with DHA (70 µM) in combination with NAC for 6 h. After fixation, the cells were immunostained for NFE2L2. Data are representative for 2 independent experiments. The percentage of cells with NFE2L2 nuclear staining from one representative experiment was automatically quantified using ScanR automated image acquisition. Each experiment was performed in duplicate and the data displayed represent the average percentage number of cells with NFE2L2 nuclear staining ± SD. (F) ARPE-19 cells were pretreated with NAC (5 mM) for 1 h following stimulation with DHA (70 µM) for 6 h and BafA1 (100 nM) the last 2 h. Levels of HMOX1 was determined by immunoblotting. COX4I1 was used as loading control. (G) The ARPE-19 cells were treated with DHA, OA or AA (70 µM) with or without BafA1 (100 nM) for 16 h before immunoblotting for HMOX1 (100 µg protein loaded). ACTB/β-actin and PCNA were used as loading controls. (H) Immunoblot of NFE2L2, HMOX1, KEAP1 (100 µg protein loaded), SQSTM1, ACTB and PCNA (loaded 20 µg protein) after DHA (70 µM) with or without BafA1 (100 nM) for 16 h. Arrows represent NFE2L2 and KEAP1 bands while *) represents a nonspecific NFE2L2 band. ACTB and PCNA were used as loading controls. (I) Cells were treated as in (G) and immunoblotted for phosphorylated SQSTM1 (Ser351) and total SQSTM1 (100 µg protein loaded). ACTB and PCNA were used as loading controls. Data shown are representative of 3 or more independent experiments, unless otherwise stated.
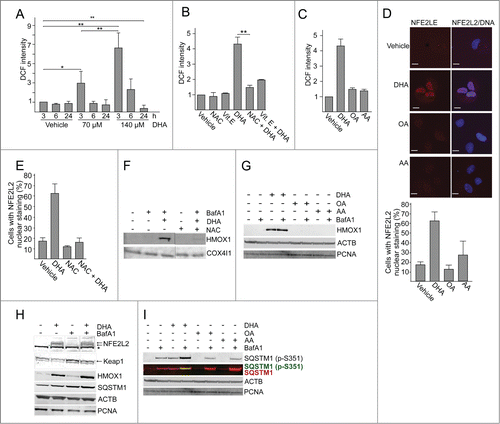
Figure 3. DHA induces a transient increase in ROS and induce NFE2L2 cytoprotective genes. (A) Changes in ROS levels measured at different time points after DHA (70 and 140 µM) using a fluorescent ROS DCF probe. The data represent the mean fold change ± SD for 6 independent experiments for 3 h and 3 independent experiments for 6 h and 24 h. Each experiment was performed in duplicates where the mean intensity of 10,000 cells per well ± SD was measured. *) indicates significantly different from control, Student t test P < 0.05 and **) P < 0.01. (B) Where indicated the cells were pretreated with antioxidants (5 mM N-acetyl-cysteine (NAC) or 150 µM vitamin E) for 16 h before further stimulations with 140 µM DHA for 3 h. The data represent the average of 3 independent experiments for the DHA and NAC treatments and the average of 2 independent experiments for the Vitamin E treatment. Each experiment was performed in duplicates where the mean intensity of 10,000 cells per well ±SD was measured. **) indicates significantly different from DHA, Student t test P < 0.01. (C) Changes in ROS levels measured 3 h after DHA, OA or AA (140 µM) supplementation using a DCF fluorescent probe. The data represent the average of 3 independent experiments ±SD for DHA treated samples and 2 independent experiments ±SD for AA and OA treated samples. Each experiment was performed in duplicates where the mean intensity of 10,000 cells ±SD per well was measured. (D) Immunostaining of NFE2L2 after 70 µM DHA, OA, AA for 6 h. Nuclear DNA was stained using Draq5 (5 µM). Scale bar: 10 µm. The results are representative for 3 independent experiments. Nuclear NFE2L2 staining from one representative experiment was automatically quantified using ScanR automated image acquisition of more than 3,000 cells. Each experiment was performed in duplicates and the data are presented as average percentage number of cells with NFE2L2 nuclear staining ± SD. (E) The cells were pretreated with NAC (5 mM) for 1 h prior to further stimulation with DHA (70 µM) in combination with NAC for 6 h. After fixation, the cells were immunostained for NFE2L2. Data are representative for 2 independent experiments. The percentage of cells with NFE2L2 nuclear staining from one representative experiment was automatically quantified using ScanR automated image acquisition. Each experiment was performed in duplicate and the data displayed represent the average percentage number of cells with NFE2L2 nuclear staining ± SD. (F) ARPE-19 cells were pretreated with NAC (5 mM) for 1 h following stimulation with DHA (70 µM) for 6 h and BafA1 (100 nM) the last 2 h. Levels of HMOX1 was determined by immunoblotting. COX4I1 was used as loading control. (G) The ARPE-19 cells were treated with DHA, OA or AA (70 µM) with or without BafA1 (100 nM) for 16 h before immunoblotting for HMOX1 (100 µg protein loaded). ACTB/β-actin and PCNA were used as loading controls. (H) Immunoblot of NFE2L2, HMOX1, KEAP1 (100 µg protein loaded), SQSTM1, ACTB and PCNA (loaded 20 µg protein) after DHA (70 µM) with or without BafA1 (100 nM) for 16 h. Arrows represent NFE2L2 and KEAP1 bands while *) represents a nonspecific NFE2L2 band. ACTB and PCNA were used as loading controls. (I) Cells were treated as in (G) and immunoblotted for phosphorylated SQSTM1 (Ser351) and total SQSTM1 (100 µg protein loaded). ACTB and PCNA were used as loading controls. Data shown are representative of 3 or more independent experiments, unless otherwise stated.

Figure 4. ATG5 is important in the cellular responses to DHA. (A) ARPE-19 cells were transfected with control siRNA or ATG5 siRNA (100 nM) and left for 24 h before reseeding. Following incubation for 24 h, the cells were added DHA (70 μM) or BafA1 (100 nM) for 24 h and immunoblotted for ATG5, SQSTM1, and MAP1LC3B. ACTB and PCNA were used as loading controls. (B) The cells were siRNA-transfected as in (A). After DHA (140 µM) treatment for 3 h changes in ROS levels were measured using a fluorescent ROS DCF probe. The results are representative for 2 independent experiments. Each experiment was performed in duplicates where the mean intensity ±SD of 10,000 cells per well was measured. The control is normalized to one and the relative fold changes are shown. (C) Relative cell index after transfection with control or ATG5 siRNA (100 nM) after vehicle or DHA (140 μM) based on real-time monitoring using the xCELLigence instrument. The cell index for each treatment was normalized to one at the start of the experiment. For each time point the cell index of control samples (Control siRNA + vehicle and ATG5 siRNA + vehicle) was normalized to 1. The effect of DHA treatment after transfection with either Control siRNA or ATG5 siRNA is shown relative to the corresponding controls. Mean normalized cell index with standard deviation of triplicate wells of vehicle or DHA treated cells is displayed. Data shown are representative for 2 independent experiments.
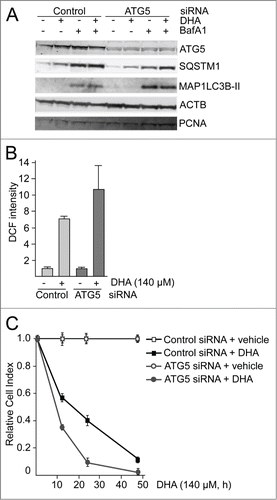
Figure 4. ATG5 is important in the cellular responses to DHA. (A) ARPE-19 cells were transfected with control siRNA or ATG5 siRNA (100 nM) and left for 24 h before reseeding. Following incubation for 24 h, the cells were added DHA (70 μM) or BafA1 (100 nM) for 24 h and immunoblotted for ATG5, SQSTM1, and MAP1LC3B. ACTB and PCNA were used as loading controls. (B) The cells were siRNA-transfected as in (A). After DHA (140 µM) treatment for 3 h changes in ROS levels were measured using a fluorescent ROS DCF probe. The results are representative for 2 independent experiments. Each experiment was performed in duplicates where the mean intensity ±SD of 10,000 cells per well was measured. The control is normalized to one and the relative fold changes are shown. (C) Relative cell index after transfection with control or ATG5 siRNA (100 nM) after vehicle or DHA (140 μM) based on real-time monitoring using the xCELLigence instrument. The cell index for each treatment was normalized to one at the start of the experiment. For each time point the cell index of control samples (Control siRNA + vehicle and ATG5 siRNA + vehicle) was normalized to 1. The effect of DHA treatment after transfection with either Control siRNA or ATG5 siRNA is shown relative to the corresponding controls. Mean normalized cell index with standard deviation of triplicate wells of vehicle or DHA treated cells is displayed. Data shown are representative for 2 independent experiments.

Figure 5. The atg5 knockout MEFs are more sensitive to DHA compared to wild-type MEFs. (A) The levels of ROS were measured in wild-type (WT) and atg5−/− MEFs after 3 h DHA treatment (70 and 140 µM) using the fluorescent DCF probe. The data from one representative experiment of 3 independent experiments are displayed. Each experiment was performed in triplicate wells where the mean intensity ±SD of 10,000 cells per well was measured. (B) The levels of NFE2L2 and SQSTM1 after vehicle or DHA (70 μM, 16 h) treatment in wild-type and atg5−/− MEFs (85 μg protein loaded). TUBB/β-tubulin was used as loading control. The immunoblot is representative for 3 independent experiments. (C) Wild-type and atg5−/− MEFs were exposed to DHA (75 μM) and cellular responses observed over time using the xCELLigence real-time monitoring system. The cell index was normalized to one at the start of the experiment. Mean normalized cell index ±SD of triplicate wells of vehicle or DHA treated cells are displayed. The results are representative for 5 independent growth experiments scored by cell index using xCELLigence.
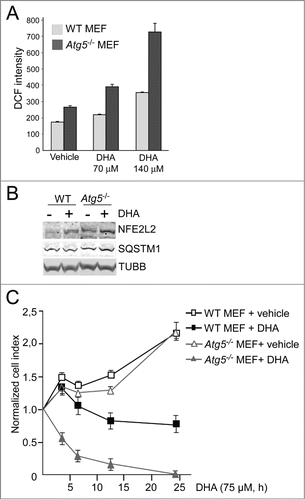
Figure 5. The atg5 knockout MEFs are more sensitive to DHA compared to wild-type MEFs. (A) The levels of ROS were measured in wild-type (WT) and atg5−/− MEFs after 3 h DHA treatment (70 and 140 µM) using the fluorescent DCF probe. The data from one representative experiment of 3 independent experiments are displayed. Each experiment was performed in triplicate wells where the mean intensity ±SD of 10,000 cells per well was measured. (B) The levels of NFE2L2 and SQSTM1 after vehicle or DHA (70 μM, 16 h) treatment in wild-type and atg5−/− MEFs (85 μg protein loaded). TUBB/β-tubulin was used as loading control. The immunoblot is representative for 3 independent experiments. (C) Wild-type and atg5−/− MEFs were exposed to DHA (75 μM) and cellular responses observed over time using the xCELLigence real-time monitoring system. The cell index was normalized to one at the start of the experiment. Mean normalized cell index ±SD of triplicate wells of vehicle or DHA treated cells are displayed. The results are representative for 5 independent growth experiments scored by cell index using xCELLigence.

Figure 6. NFE2L2 and SQSTM1 are important in the cellular responses to DHA in ARPE-19 cells. (A) Cells were transfected with control, NFE2L2 and SQSTM1 siRNA (25 nM) and left for 24 h before reseeding. Following incubation for 24 h, the cells were added DHA (70 μM) or BafA1 (100 nM) for 24 h. Immunoblot for SQSTM1 and MAP1LC3B. ACTB/β-actin and PCNA were used as loading controls. (B) The cells were siRNA-transfected as in (A). After vehicle (V) and DHA (70 and 140 µM) treatment for 3 h changes in ROS levels were measured using a fluorescent ROS DCF probe. The data are representative for 2 independent experiments both performed in duplicates. The data represent the mean intensity ±SD of 10,000 cells per well and is displayed as relative DCF intensity. (C) Relative cell index after transfection with control, NFE2L2 or SQSTM1 siRNA (25 nM) after vehicle and DHA treatment (70 μM) based on real-time monitoring using the xCELLigence instrument. The cell index was normalized to one at the start of the experiment. Mean normalized cell index with standard deviation of triplicate wells of vehicle and DHA treated cells is displayed. Data shown are representative for 3 independent experiments.
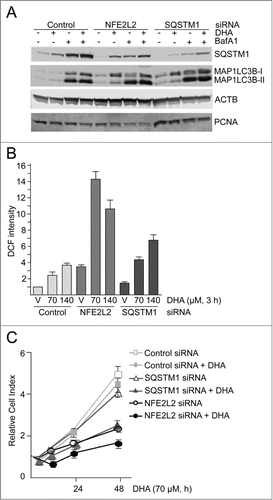
Figure 6. NFE2L2 and SQSTM1 are important in the cellular responses to DHA in ARPE-19 cells. (A) Cells were transfected with control, NFE2L2 and SQSTM1 siRNA (25 nM) and left for 24 h before reseeding. Following incubation for 24 h, the cells were added DHA (70 μM) or BafA1 (100 nM) for 24 h. Immunoblot for SQSTM1 and MAP1LC3B. ACTB/β-actin and PCNA were used as loading controls. (B) The cells were siRNA-transfected as in (A). After vehicle (V) and DHA (70 and 140 µM) treatment for 3 h changes in ROS levels were measured using a fluorescent ROS DCF probe. The data are representative for 2 independent experiments both performed in duplicates. The data represent the mean intensity ±SD of 10,000 cells per well and is displayed as relative DCF intensity. (C) Relative cell index after transfection with control, NFE2L2 or SQSTM1 siRNA (25 nM) after vehicle and DHA treatment (70 μM) based on real-time monitoring using the xCELLigence instrument. The cell index was normalized to one at the start of the experiment. Mean normalized cell index with standard deviation of triplicate wells of vehicle and DHA treated cells is displayed. Data shown are representative for 3 independent experiments.
Supplemental material

1061170_Fig_S2.pdf

Download PDF (499.3 KB)

1061170_Fig_S1.pdf

Download PDF (260 KB)