
Figures & data
Figure 1. Measurement of body weight in treated (DEX: dexamethasone (10 mg/kg i.p) or PFD: Pirfenidone (200 mg/kg i.p)) and untreated rats (SO2) exposed to a 10-min exposure to 2200 ppm sulfur dioxide (SO2). Control animals were breathing room-air while the other rats were exposed to SO2. Statistical significant differences between initial weight and weight on termination day within each group are shown. (A) 24 h post-exposure (n = 6 rats per group) and (B) 14-days post-exposure (n = 5–6 rats per group). #Two animals in the 14-day SO2 group were excluded on day 13–14 from the study due to severe decline in general health status (last time-point n = 4) Values indicate means ± SEM, **p < .01, and ***p < .001.
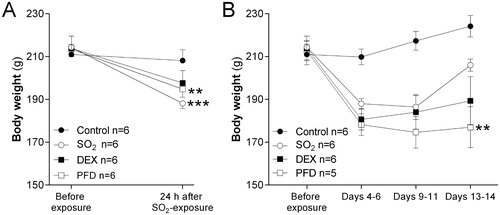
Figure 2. Total cell counts in bronchoalveolar lavage fluid (BALF) from rats exposed to 2200 ppm sulfur dioxide (SO2) at 24 h post-exposure, after treatment with dexamethasone (DEX, 10 mg/kg i.p) or pirfenidone (PFD, 200 mg/kg i.p) at 1 h, 5 h and 23 h. The numbers of (A) total leukocytes, macrophages and neutrophils and (B) eosinophils and lymphocytes are shown. Values indicate means ± SEM. Statistical significant differences compared to untreated SO2-group (vehicle) are shown, *p < .05, **p < .01 and ***p < .001 (n = 6 rats per group).
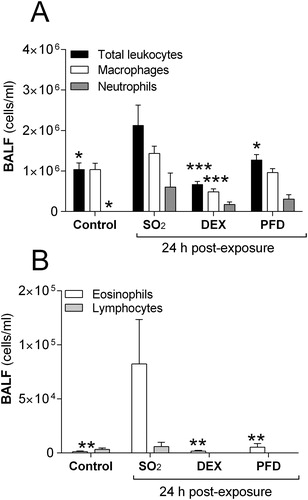
Table 1. Cytokines in bronchoalveolar lavage fluid (BALF) and serum, measured 24 h after a 10-minute exposure of female rats to 2200 ppm sulfur dioxide (SO2), with and without post-exposure treatment (1, 5 and 23 h after SO2-exposure).
Figure 3. Respiratory mechanics in rats 24 h after exposure to 2200 ppm sulfur dioxide (SO2) and treatment (1 h, 5 h and 23 h) with dexamethasone (DEX, 10 mg/kg i.p) or pirfenidone (PFD, 200 mg/kg i.p). Measurements of methacholine (MCh)-induced (A) respiratory resistance, RRS (B) Newtonian resistance, RN (C) tissue resistance, G (D) respiratory elastance, ERS (E) tissue elastance, H and (F) hysteresivity (η) were performed using the Flexivent™. Values indicate means ± SEM. Statistical significant differences compared to untreated SO2-group are shown, *, #p < .05, **, # #, ¤¤p < .01, and ***, # # #, ¤¤ ¤p < .001 (*SO2 vs. control, #SO2 vs. PFD and ¤SO2 vs. DEX), (n = 6 rats per group).
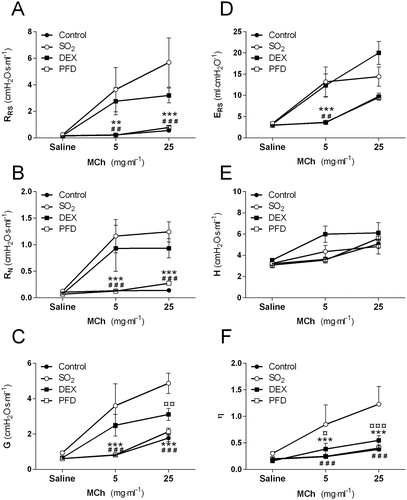
Table 2A. Acute effects of sulfur dioxide (SO2) at 24 h post-exposure. Measurement of baseline respiratory mechanics (without methacholine) in female rats exposed for 10 minutes to 2200 ppm SO2, with and without treatments (1, 5 and 23 h after SO2-exposure).
Figure 4. Lung tissue sections from (A) healthy control and (B–D) rats 24 h post-exposure to 2200 ppm sulfur dioxide (SO2), (B) without treatment (vehicle) and with (C) dexamethasone (DEX, 10 mg/kg i.p)-treatment, or (D) pirfenidone (PFD, 200 mg/kg i.p)-treatment. Tissue sections were stained with hematoxylin-eosin and photos were taken at 20 x magnification using a light microscope. AL = airway lumen.
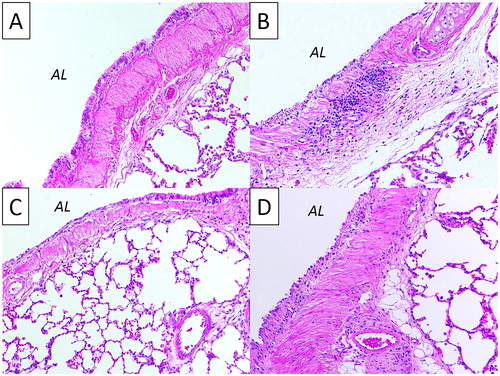
Table 2B. Analysis of collagen deposition in female rats at 14 days post-exposure for 10 minutes to 2200 ppm SO2, with and without treatments (1, 5 and 23 h after SO2-exposure).
Table 3. Scoring the main histopathology features in female rats 24 h after a 10-minute exposure to 2200 ppm sulfur dioxide (SO2), with and without post-exposure treatments (1, 5 and 23 h after SO2-exposure).