Figures & data
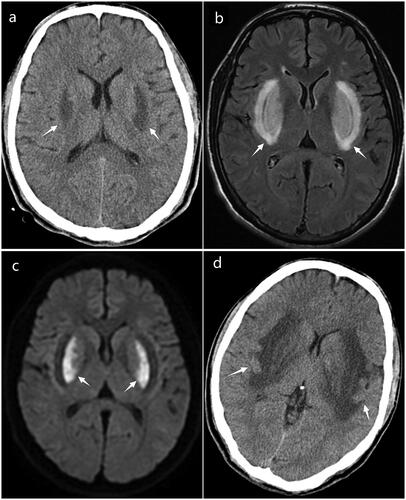
Figure 1. (a) A computed tomography scan taken 20 hours post-admission reveals symmetrical hypodensities in the bilateral basal ganglia (arrows). (b) A magnetic resonance image at 80 hours post-admission, T2-weighted-fluid-attenuated inversion recovery (T2-FLAIR) displays bilateral hyperintensities in the basal ganglia, indicative of the lentiform fork sign (arrows). (c) Diffusion-weighted image (DWI) shows diffusion restriction in the lentiform nuclei (arrows). (d) A follow-up computed tmography scan on day 19 post-admission demonstrates an expanded area of edema with evidence of hemorrhagic conversion (arrows).