Figures & data
Table 1. Properties for chemicals included in the study.
Table 2. Compound-specific settings for analysis of tributylamine and 2-butoxyethanol.
Figure 1. Cumulative penetration following skin exposure to neat agent concentration during 5 h experimental time. Acrylonitrile (top line), 2-butoxyethanol (2nd line), ethyl lactate (3rd line), methyl salicylate (4th line) and tributylamine (5th line). The results are presented as mean ± SEM (n = 6).
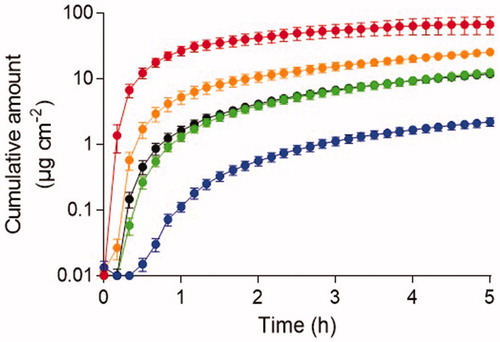
Table 3. The cumulative amount of chemicals penetrated through human dermatomed skin with or without water decontamination.
Figure 2. The penetration rate patterns for the neat agent concentration of (A) acrylonitrile, (B) 2-butoxyethanol, (C) ethyl lactate, (D) methyl salicylate, and (E) tributylamine following water decontamination. Decontamination was initiated after 5 min (open green), 15 min (closed green), 45 min (open blue), 2 h (closed blue) and without decontamination (black). Control line is the top line for all chemicals and the time points follow the order by which decontamination was initiated. Values are presented as the mean ± the SEM (n = 6). *p < 0.05 indicates significantly decreased penetration rate from the indicated time-point to the end of the experiment compared to experiment without decontamination.
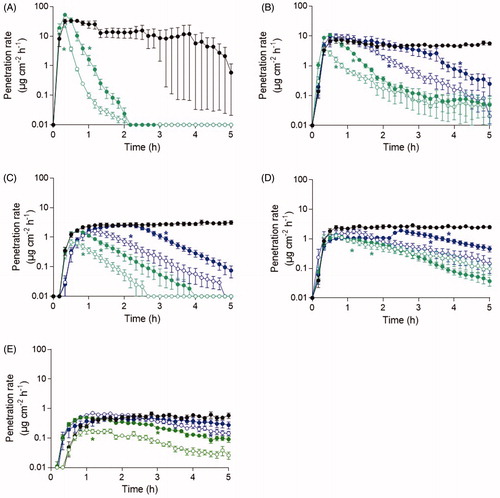
Table 4. The cumulative amount of chemicals penetrated through human dermatomed skin with or without decontamination with 2% soapy water.
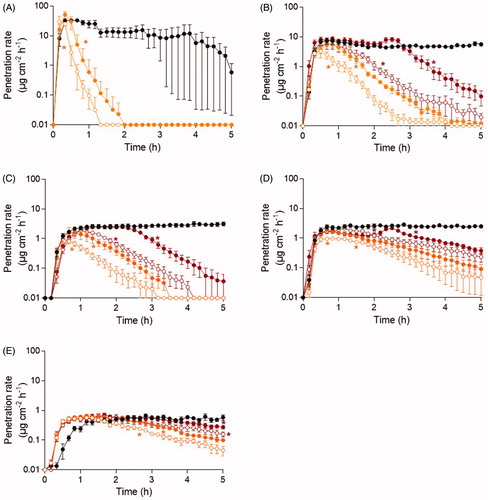
Figure 3. The penetration rate patterns for the neat agent concentration of (A) acrylonitrile, (B) 2-butoxyethanol, (C) ethyl lactate, (D) methyl salicylate, and (E) tributylamine following soapy water decontamination. Decontamination was initiated after 5 min (open orange), 15 min (closed orange), 45 min (open red), 2 h (closed red) and without decontamination (black). Control line is the top line for all chemicals and the time points follow the order by which decontamination was initiated. Values are presented as the mean ± the SEM (n = 6). *p < 0.05 indicates significantly decreased penetration rate from the indicated time-point to the end of the experiment compared to experiment without decontamination.