Figures & data
Table 1. SCJ detergent formulation used in the study.
Table 2. BCOP Test Results of the test substance i.e. laundry detergent, negative control i.e. sterile deionised water, and Positive Control i.e. ethanol based on the OECD test guideline 437.
Table 3. Scoring criteria of sodium fluorescein stain retention on corneas.
Figure 1. Negative control (sterile, deionised water), 10-min exposure, 120-min post-exposure. (A) Full thickness, magnification 42x (B) Epithelium, magnification 420x (C) Stroma directly below the anterior limiting lamina, magnification 420x (D) Endothelium, magnification 420x.
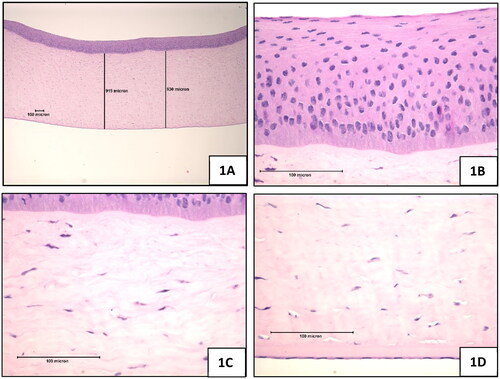
Figure 2. Positive control (100% ethanol), 10-min exposure, 120-min post-exposure. (A) Full thickness of the cornea which was appreciably thicker than the negative control treated corneas, magnification 42x (B) Epithelium, magnification 420x (C) Upper stroma showing hyperchromic staining i.e. coagulation in the zone directly below the anterior limiting lamina, stromal swelling, and the decrease in density of viable keratocytes, magnification 420x (D) Stroma near mid depth showing stromal swelling and keratocyte nuclear enlargement, magnification 420x (E) Endothelium (intact), magnification 420x.
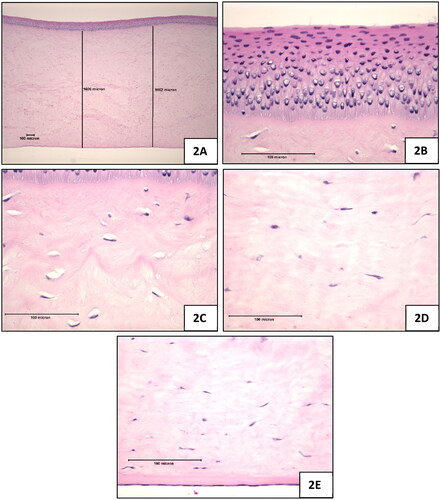
Figure 3. Test Substance (laundry detergent, neat), 10-min exposure, 120-min post-exposure. (A) Full thickness view of the cornea which was appreciably thicker than the negative control treated corneas, magnification 42x (B) Epithelium was lost in all sections, magnification 420x (C) Stroma directly beneath the anterior limiting lamina showing marked stromal swelling, and keratocyte degeneration, magnification 420x (D) Stroma near mid depth showing marked stromal swelling and moderate keratocyte enlargement, magnification 420x (E) lower stroma showing moderate collagen swelling without an appreciable increase in keratocyte changes, magnification 420x (F) Endothelium was generally intact, magnification 420x.
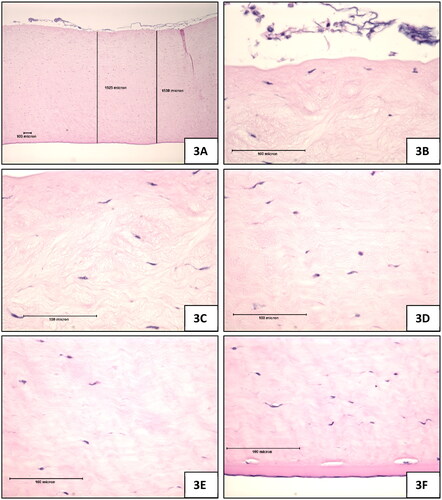
Figure 4. Representative (A) digital images of NaFL staining of the dPBS-treated corneas (n = 4) (B) scoring table. The images show corneal damage and a decrease in stain retention over time. On each day, the corneas were not in the same order. The assigned NaFL stain-retention score of the dPBS-treated corneas are presented in Table (see for the scoring scale). Areas of stain retention (yellow–brown coloured stain) are indicated with arrows, depicting damage to the corneas.
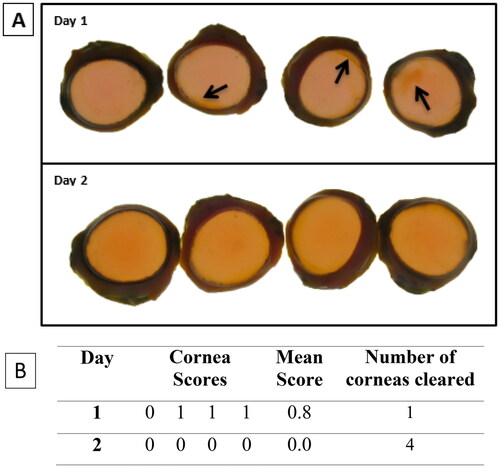
Figure 5. Representative (A) digital images of NaFL staining of the Ethanol-treated corneas (n = 4) (B) scoring table. The images show corneal damage and a decrease in stain retention over time. On each day, the corneas were not in the same order. The assigned NaFL stain-retention score of the 100% Ethanol-treated corneas are presented in Table (see for the scoring scale). Areas of stain retention (yellow–brown coloured stain) are indicated with arrows, depicting the damage to the corneas.
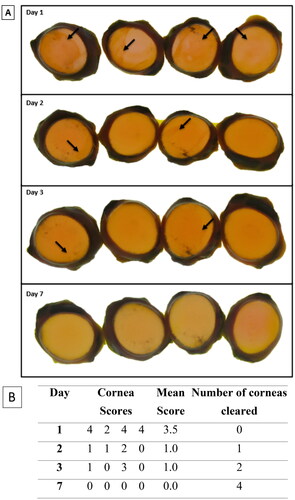
Figure 6. Representative (A) digital images of NaFL staining of the NaOH-treated corneas (n = 4) (B) scoring table. The images show corneal damage and a decrease in stain retention over time. On each day, the corneas were not in the same order. The assigned NaFL stain-retention score of the 10% NaOH scores are presented in Table (see for the scoring scale). The entire surface of the corneas are covered with stain retention (yellow–brown coloured stain), depicting the damage to the corneas.
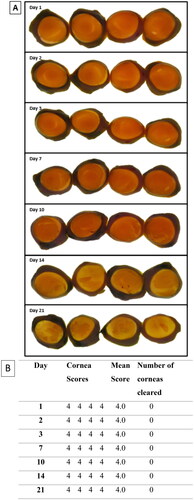
Figure 7. Representative digital images of NaFL staining of the SCJ consumer product-treated corneas (n = 4) (B) scoring table. The images show corneal damage and a decrease in stain retention over time. On each day, the corneas were not in the same order. The assigned NaFL stain-retention score of the SCJ consumer product scores are presented in Table (see for the scoring scale). Areas of stain retention (yellow–brown coloured stain) are indicated with arrows, depicting the damage to the corneas.
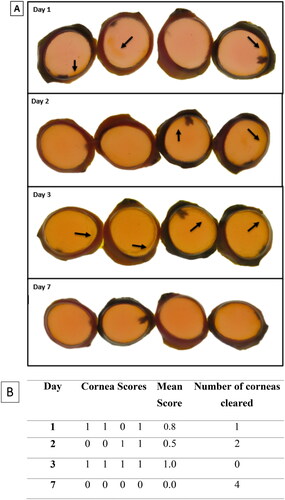
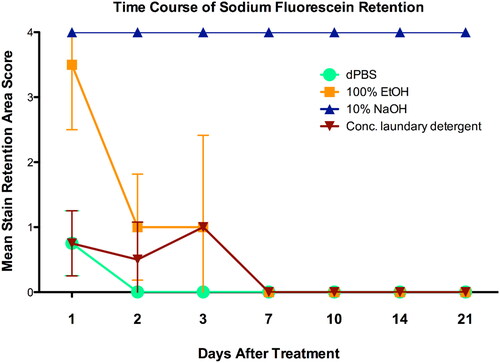
Figure 8. NaFL staining area over time by treatment group. Each line represents the progression towards loss of stain retention or re-epithelialization of a treatment group (n = 4 corneas) and each data point indicates the mean assigned damage score (0–4; maximum = 4) per treatment group on the indicated day post-dose (study day 1 through day 21). Error bars represent the standard error of the mean.