3,027
Views
55
CrossRef citations to date
0
Altmetric
Research Paper

Methylation of SOCS3 is inversely associated with metabolic syndrome in an epigenome-wide association study of obesity

, , , , , & show all
Pages 699-707 | Received 27 May 2016, Accepted 19 Jul 2016, Published online: 05 Sep 2016

Figures & data

Figure 1. Strength of associations of genome-wide autosomal CpG methylation status with BMI% in our TFSE cohort. Manhattan plot shows the significance level of each CpG locus with BMI-percentile. Each gray dot represents an individual CpG site. The red one depicts the genome-wide significance threshold after Bonferroni correction for multiple testing, Pα=0.05 = 1.31 × 10⁻⁷. Probes with associations of nominal significance (P < 0.05) are shown. Genes and associated CpG sites that exceed the significance threshold are labeled.

Figure 1. Strength of associations of genome-wide autosomal CpG methylation status with BMI% in our TFSE cohort. Manhattan plot shows the significance level of each CpG locus with BMI-percentile. Each gray dot represents an individual CpG site. The red one depicts the genome-wide significance threshold after Bonferroni correction for multiple testing, Pα=0.05 = 1.31 × 10⁻⁷. Probes with associations of nominal significance (P < 0.05) are shown. Genes and associated CpG sites that exceed the significance threshold are labeled.

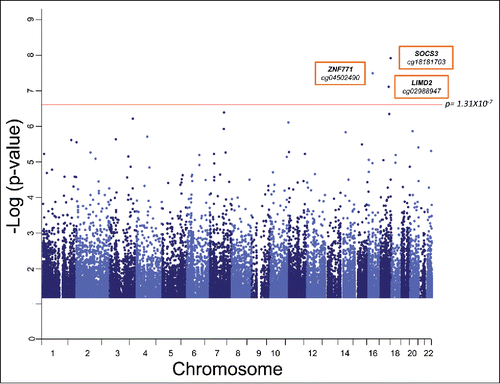
Table 1. TOPS Family Study of Epigenetics (TFSE) Cohort Characteristics.

Table 2. Top BMI% CpGs with other MetS traits and MetS itself.

Figure 2. Boxplot of methylation β values at cg18181703 (SOCS3, body) against presence or absence of metabolic syndrome. The middle lines show the medians of the data, while the boxes show the 25th to 75th percentiles. The whiskers extend to include 99% of the data while circles represent outliers. The β values at this probe in individuals with and without MetS were significantly different (P = 4.01 × 10⁻⁷) when accounted for age, sex, and interactions of the two.

Figure 2. Boxplot of methylation β values at cg18181703 (SOCS3, body) against presence or absence of metabolic syndrome. The middle lines show the medians of the data, while the boxes show the 25th to 75th percentiles. The whiskers extend to include 99% of the data while circles represent outliers. The β values at this probe in individuals with and without MetS were significantly different (P = 4.01 × 10⁻⁷) when accounted for age, sex, and interactions of the two.

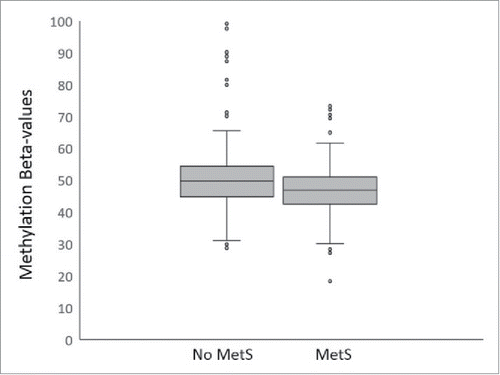
Table 3. Pyrosequencing of SOCS3 CpG site vs. traits.