Figures & data
Figure 1. Localization and histochemical staining of the differentiating endodermis and developing Casparian strips and suberin lamellae of sweet sorghum seminal roots. Freehand cross sections were made using 10-day-old seminal roots grown in nutrient solution. (a) Schematic view of endodermal differentiation. Stage I (0–10 mm from the root tip), without any Casparian strips or suberin lamellae; Stage II (20–25 mm from the root tip), with developing Casparian strips and suberin lamellae; Stage III (35–45 mm from the root tip), with developed Casparian strips and suberin lamellae. (b, d, f) Root cross sections stained with berberine aniline blue to show the Casparian bands, viewed under blue light (450 nm). Arrows indicate Casparian strips. (c, e, g) Root cross sections were stained with FY088 to show the suberin lamellae, viewed under UV illumination (365 nm). Arrows indicate suberin lamellae. mx, metaxylem; px, protoxylem; co, cortex; en, endodermis. Bar = 50 μm.
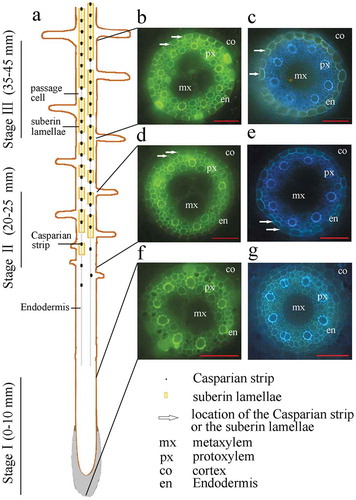
Figure 2. Number of Casparian strips and stained endodermal cells in cross sections along the sweet sorghum seminal root. (a) Number of stained Casparian strips between adjacent endodermis cells. The cells were stained using berberine hemisulfate-aniline blue dye. (b) Number of stained endodermal cells. The cells were stained using Fluorol Yellow 088. Each point represents the corresponding number at this location.
Figure 3. Venn diagram showing the number of shared and unique genes expressed in the three developmental sections of the root (expression threshold, RPKM > 1.0) .
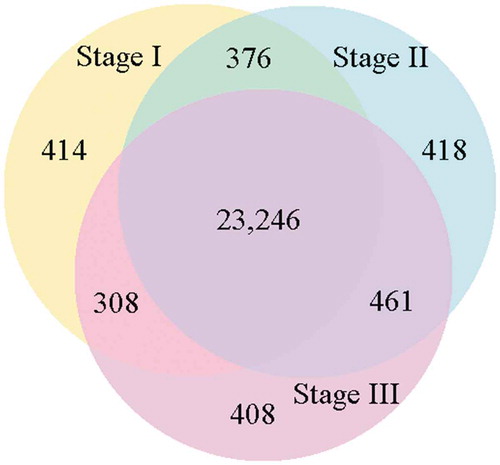
Figure 4. The DEGs mapped to the phenylpropanoid pathway (except peroxidase), with the expression levels in the three developmental sections marked as I, II, and III. The gene SORBI_3004G272700 is annotated as an uncharacterized acetyltransferase. The gene SORBI_3007G059400 is annotated as anthocyanin 5-aromatic acyltransferase. The encoded enzymes of the other genes are presented next to their accession numbers.
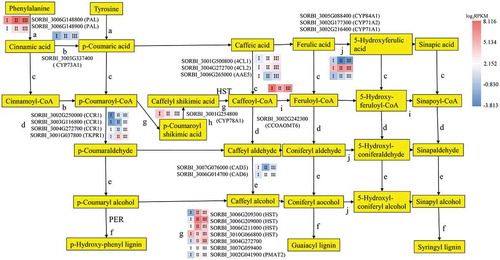
Figure 5. The distribution of the total expression of each gene in the peroxidase portion of the phenylpropanoid pathway. The gene expression level in each section is presented as a proportion of the total RPKM of the three sections.
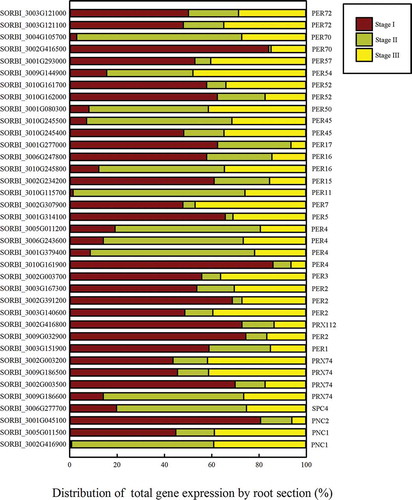
Figure 6. The expression of nine genes involved in fatty acid elongation and possible suberin development. The heatmap shows the log2 RPKM values of the expression levels.
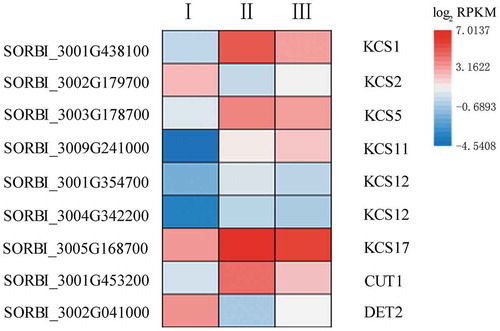
Figure 7. The expression of genes participating in fatty acid ω-hydroxylation and possible suberin development. The heatmap shows the log2 RPKM values of the expression levels.
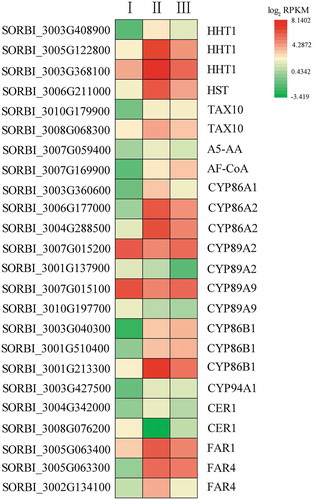
Figure 8. Differential expression of all transcription factors in the alignment of three developmental stages. The number of differentially expressed genes is specified.
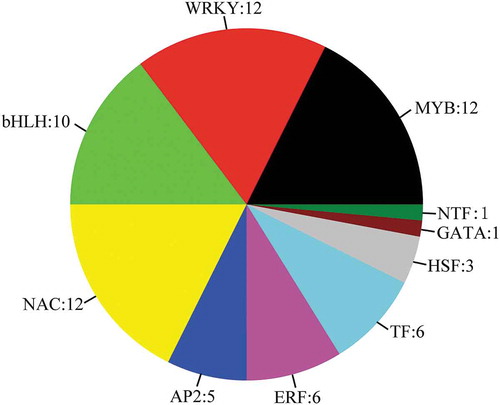
Figure 9. Validation of the RNA-seq results using qRT-PCR to analyze the expression of 12 representative candidate genes. R2 represents the correlation between the RNA-seq (RPKM) and qRT-PCR data.
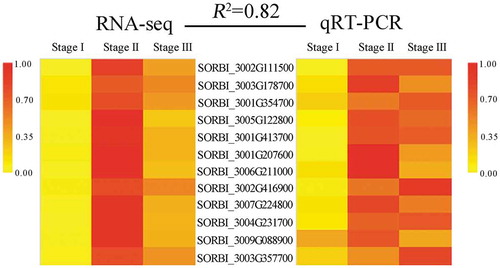
Figure 10. The physical locations of candidate genes involved on chromosomes based on BLAST results against the whole-genome sequencing dataset. Red color indicates the genes on the sense sequence and green color indicates the genes on the antisense strand.
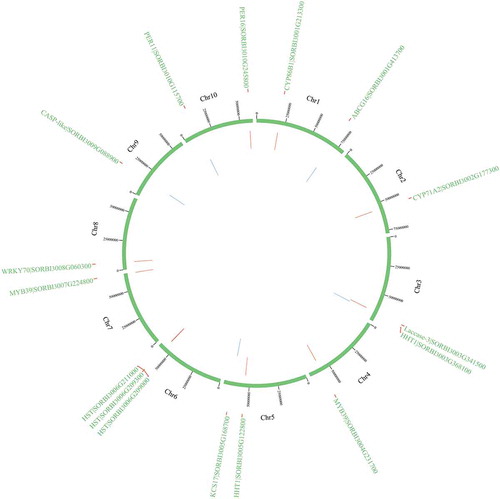
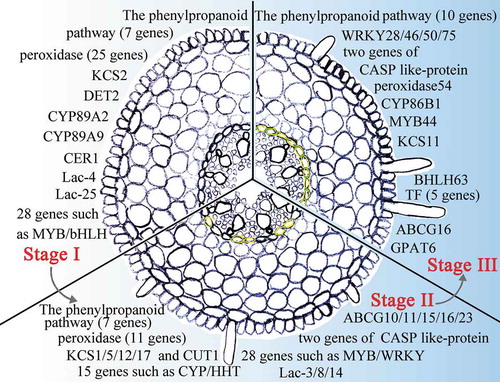
Figure 11. A model of sweet sorghum root Casparian strip and suberin lamella development. The presented genes display high levels of expression in Casparian strip- and suberin lamellae-related pathways in Stage I to Stage III of the root. Green between the endodermal cells indicates that the Casparian strip is stained in this section. The yellow endodermal cells indicate that the suberin lamellae of the cells in this section are stained.