Figures & data
Figure 1. Study Protocol. DLPFC, PAC and dACC generate the auditory-evoked gamma-band response. CHR: Clinical High-Risk; -NP: Non-Psychosis; -P: Psychosis; dACC: dorsal Anterior Cingulate Cortex; DLPFC: Dorsolateral Prefrontal Cortex; HC: Healthy Controls; PAC: Primary Auditory Cortex.
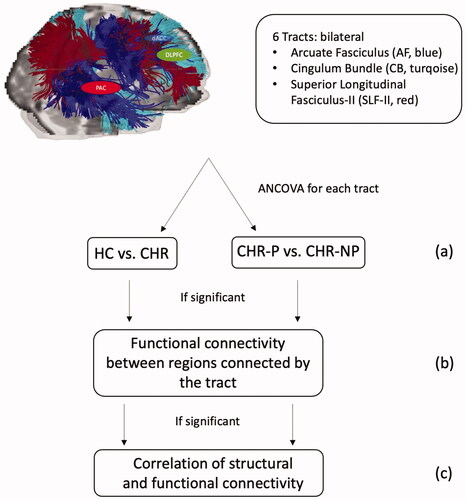
Figure 2. Clustering results of the (a) AF, (b) CB and (c) SLF-II of a CHR subject. White matter fibre clustering was used to extract tracts for each subject. AF: Arcuate Fasciculus; CB: Cingulum Bundle; CHR: Clinical High-Risk; SLF-II: Superior Longitudinal Fasciculus II.
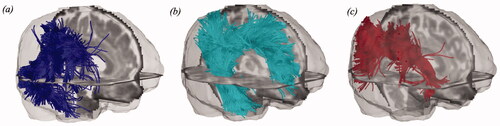
Table 1. Demographic and clinical characteristics.
Figure 3. FA and LPS compared between CHR subjects and HC. CHR subjects exhibited significantly increased FA in the right AF compared to HC (CHR: .64 ± .02; HC: .61 ± .03; F(1, 34) = 12.41; p < .001, η2 = .31). The LPS between right PAC and DLPFC, which are connected by the AF, was decreased in CHR subjects compared to HC (CHR: .69 ± .14; HC: .77 ± .12; F(1, 37) = 3.3; p = .078, η2 = .08). AF: Arcuate Fasciculus; CHR: Clinical High-Risk; DLPFC: Dorsolateral Prefrontal Cortex; FA: free-water corrected Fractional Anisotropy; HC: Healthy Controls; LPS: Lagged Phase Synchronisation; PAC: Primary Auditory Cortex.
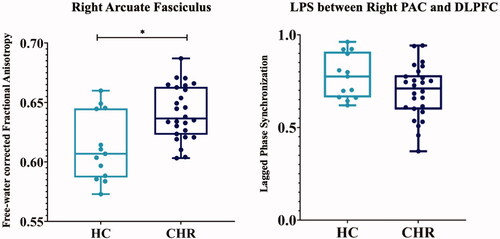
Table 2. ANCOVAs for group differences in each tract.
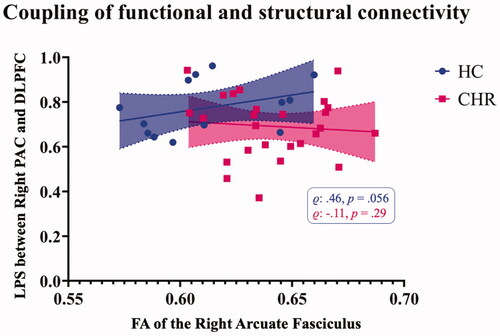
Figure 4. Correlation of functional and structural connectivity measures. In HC, the FA of the right AF was positively correlated with the LPS between the respective regions, right PAC and DLPFC. This correlation was absent in CHR individuals. AF: Arcuate Fasciculus; CHR: Clinical High-Risk; DLPFC: Dorsolateral Prefrontal Cortex; FA: free-water corrected Fractional Anisotropy; HC: Healthy Controls; LPS: Lagged Phase Synchronisation; PAC: Primary Auditory Cortex.