Free access
Novel gelatin-polyoxometalate based self-assembled pH responsive hydrogels: formulation and in vitro characterization
Reprints and Corporate Permissions
Please note: Selecting permissions does not provide access to the full text of the article, please see our help page How do I view content?
To request a reprint or corporate permissions for this article, please click on the relevant link below:
Academic Permissions
Please note: Selecting permissions does not provide access to the full text of the article, please see our help page How do I view content?
Obtain permissions instantly via Rightslink by clicking on the button below:
If you are unable to obtain permissions via Rightslink, please complete and submit this Permissions form. For more information, please visit our Permissions help page.
Related research
People also read lists articles that other readers of this article have read.
Recommended articles lists articles that we recommend and is powered by our AI driven recommendation engine.
Cited by lists all citing articles based on Crossref citations.
Articles with the Crossref icon will open in a new tab.

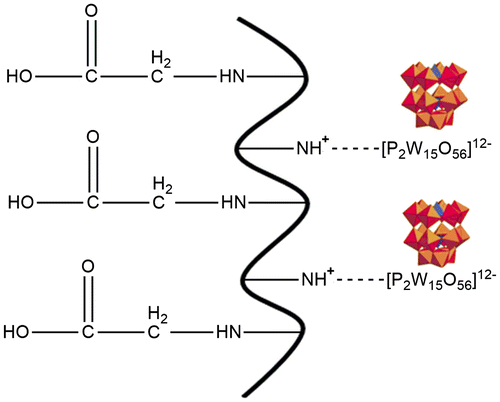
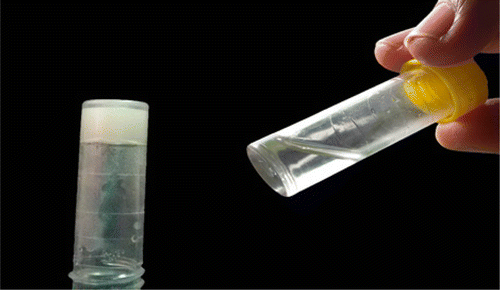
![Figure 3. Effect of gelatin concentration on [P2W15O56]12- release.](/cms/asset/bc28c4ec-3446-49c0-8393-d301263b729e/tdmp_a_1209629_f0003_oc.gif)
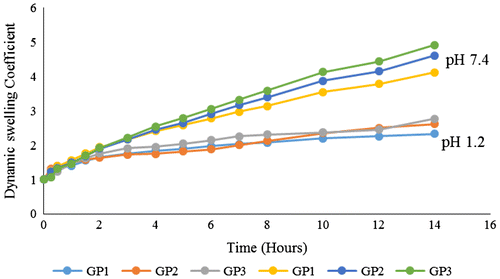
![Figure 5. Effect of acrylic acid concentration on [P2W15O56]12- release.](/cms/asset/0404b6fa-f92f-4a80-a390-c73b32739a01/tdmp_a_1209629_f0005_oc.gif)
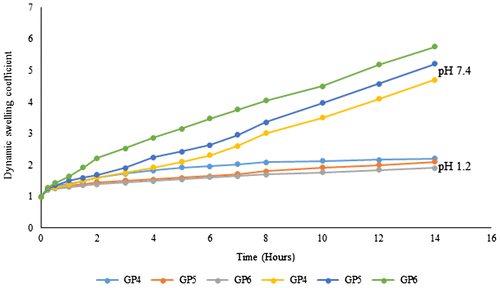
![Figure 7. Effect of [P2W15O56]12- concentration on cumulative % release.](/cms/asset/f3e41871-925b-4c30-bbf7-b23c6ddbad83/tdmp_a_1209629_f0007_oc.gif)
![Figure 8. Effect of [P2W15O56]12- concentration on swelling of hydrogel.](/cms/asset/0353fee8-ab97-4995-af2a-c535f0b05880/tdmp_a_1209629_f0008_oc.gif)
