Figures & data
Fig. 1. Changes in ozone concentration in Jilin province between 2015 and 2019.
Table 1. Comprehensive indicators of various pollutants in 2015–2019.
Fig. 2. Diurnal (a) and monthly (b) mean O3 concentration in five years.
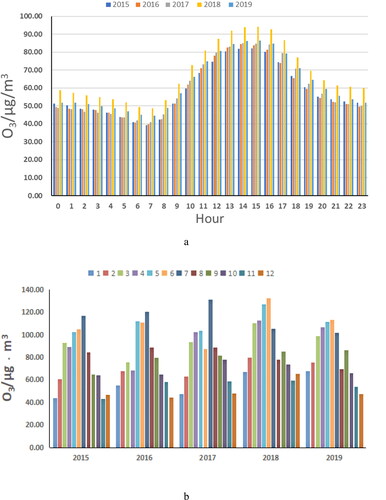
Fig. 3. 24-hour average monthly concentration change chart for 2015–2019. Y axis represents month, X axis represents time.
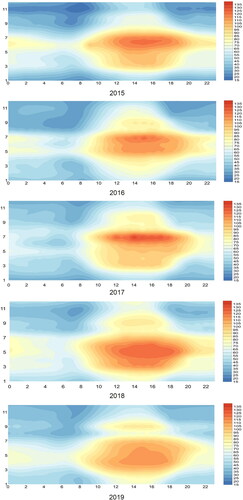
Fig. 4. Seasonal variation of O3 concentration for 2015–2019.
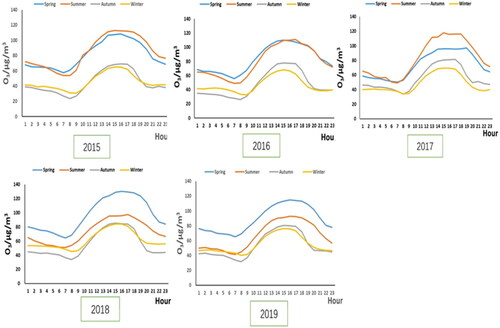
Fig. 5. Seasonal variation of average temperature for 2010–2019.
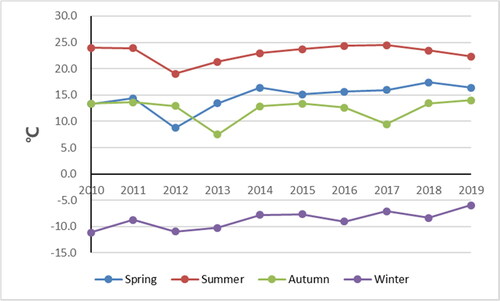
Fig. 6. Spring variation of NOx for 2015–2019.
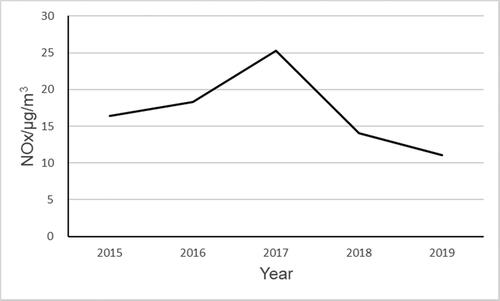
Fig. 7. 2016–2018 ozone eight-hour moving average.
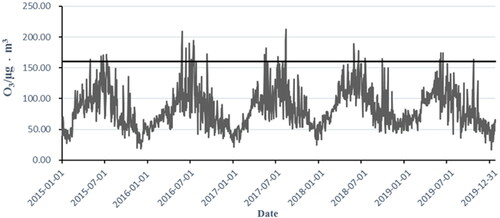
Fig. 8. Correlation between ozone temperature and other indicators.
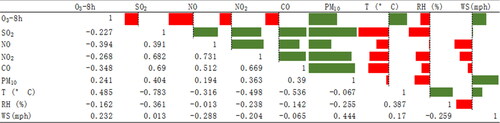
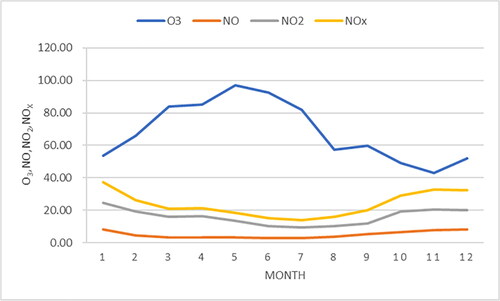
Fig. 9. Monthly variation values of O3 with NO, NO2, and NOx.