Figures & data
Fig. 1. Spatial distribution of 82 national meteorological stations in China (red solid circle).
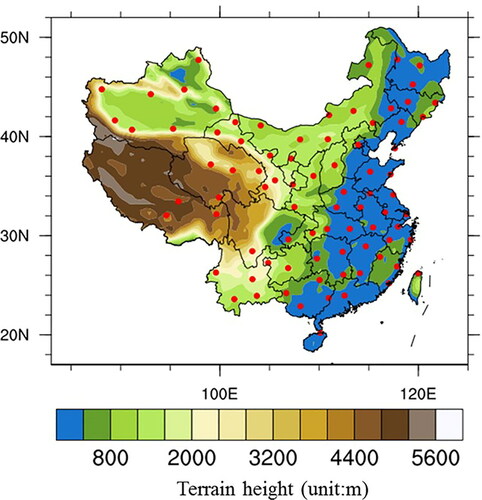
Table 1. Inversion depth in summer and winter at six stations.
Fig. 2. Annual relative frequencies of total inversion (FTI), surface-based temperature inversion (FSI), elevated temperature inversion (FEI) and both surface-based and elevated temperature inversion (FSEI) from 1976 to 2015.
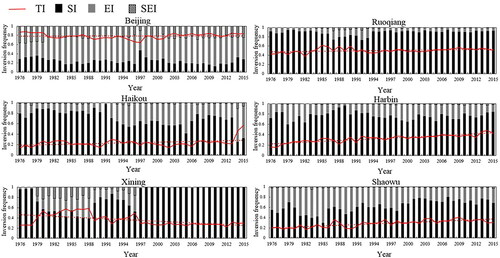
Fig. 3. Annual inversion strength from 1976 to 2015 at six stations.
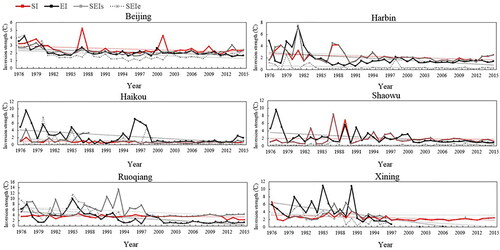
Fig. 4. Annual inversion depth from 1976 to 2015 at six stations.
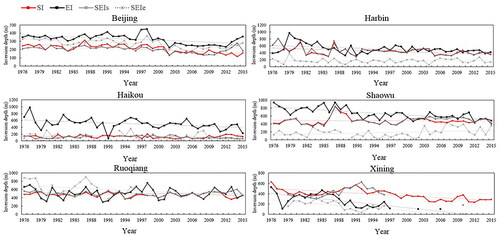
Fig. 5. Seasonal inversion strength in every year in Beijing ((a) for spring, (b) for summer, (c) for autumn and (d) for winter).
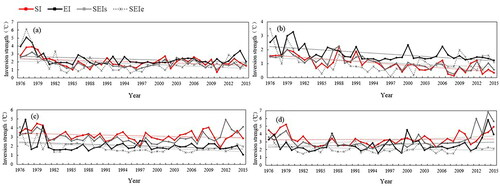
Fig. 6. Monthly FTI, FSI, FEI and FSEI at six stations.
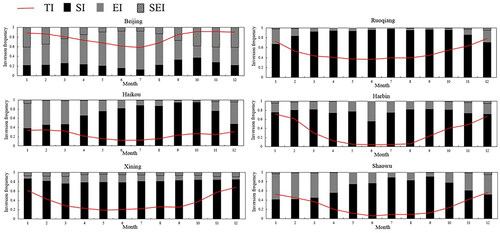
Fig. 7. Monthly inversion strength at six stations.
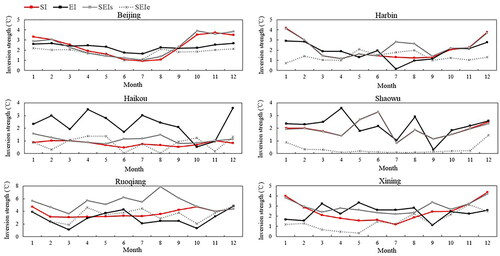
Fig. 8. Monthly inversion depth at six stations.
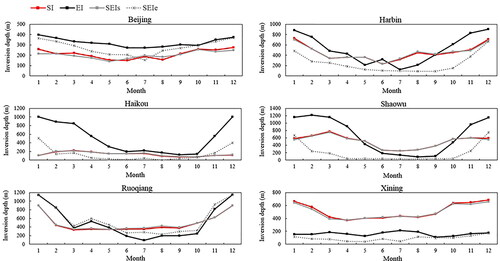
Fig. 9. Spatial variation of FTI (a), FSI (b), FEI (c) and FSEI (d).
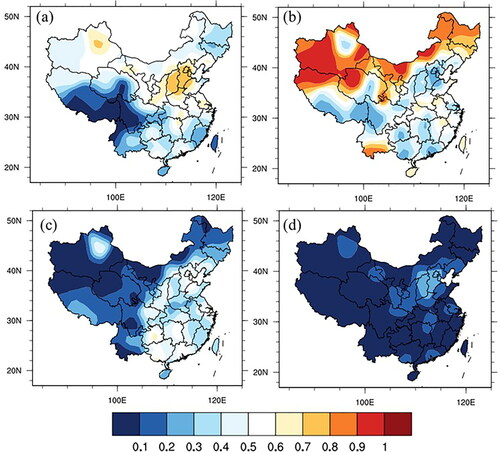
Fig. 10. Spatial variation of SI strength (a) and SEIs strength (b).
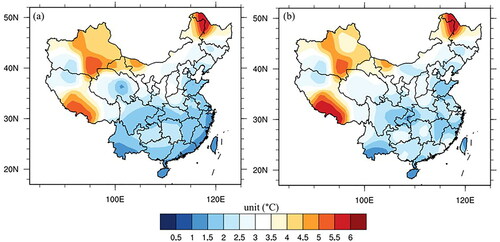
Fig. 11. Spatial variation of EI strength (a) and SEIe strength (b).
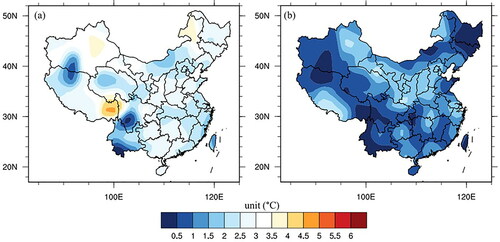
Fig. 12. Spatial variation of SI depth (a) and SEIs depth (b).
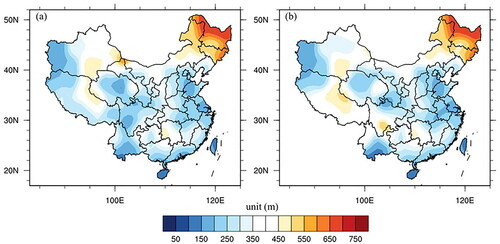
Fig. 13. Spatial variation of EI depth (a) and SEIe depth (b).
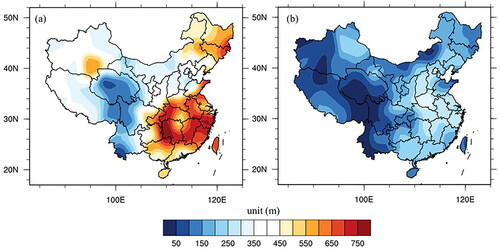
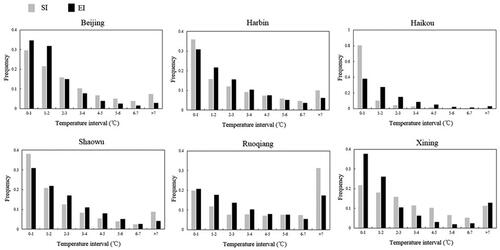
Fig. 14. Frequency of different inversion strengths at six stations, in 1 °C intervals.