
Figures & data
Table 1. Summary and short description of the used AERONET data.
Table 2. Summary and short description of MERRA-2 and AeroCom phase III models.
Table 3. Summary and short description of the control and sensitivity experiments.
Fig. 1. Left: Temporal mean of the years 2006 to 2012 of aerosol optical depth (AOD) for MODIS (a), MERRA-2 reanalysis (c) and the model control simulation (e) in the focus region. AERONET observations are illustrated as coloured circles. Right: Scatter plots of MODIS (b), MERRA-2 (d) and modelled AOD (f) against AERONET retrievals (monthly average). Note, the AOD of MODIS, MERRA-2 and AERONET is clear-sky while the modelled AOD is for all-sky.
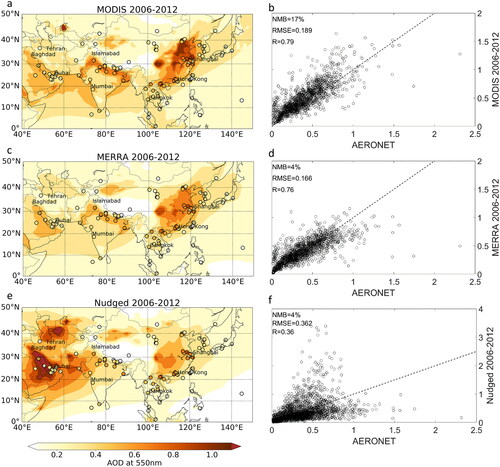
Fig. 2. Left: Temporal mean of the years 2006 to 2012 of absorption aerosol optical depth (AAOD) for MERRA-2 reanalysis (a) and the model control simulation (c) in the focus region. AERONET observations are illustrated as coloured circles. Right: Scatter plots of MERRA-2 (b) and modelled AAOD (d) against AERONET retrievals (monthly average). Note, the AAOD of MERRA-2 and AERONET is clear-sky while the modelled AAOD is for all-sky.
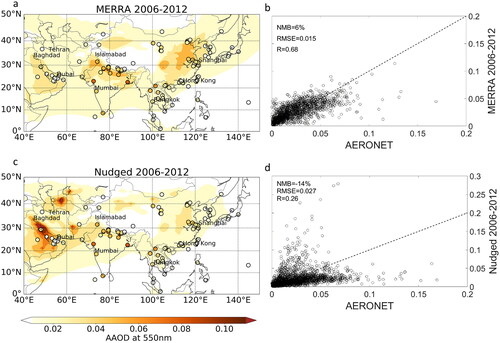
Fig. 3. AAOD timeseries from the nudged control (blue) and AMIP (black, dashed) simulations compared to AERONET (grey bars) and MERRA-2 (grey line) AAOD monthly means (Level 1.5) of selected AERONET stations. The AAOD contribution of BC (red), dust (yellow) and OA (green) to the nudged control simulation is shown as well. Note, the AAOD of BC, OA and dust does not add up to their sum due to the technical realisation of internal mixing in the model. The map in the bottom left corner shows the respective locations of the AERONET stations.
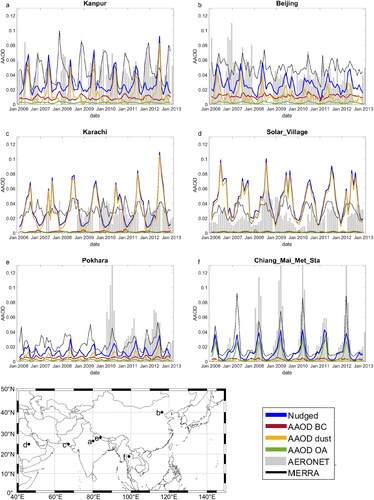
Fig. 4. Left: Annual mean of the year 2010 of aerosol optical depth (AOD) for four AeroCom phase III models in the focus region (a, c, e, g). Note, HadGEM uses a clear-sky AOD while GEOS and CAM5.3-Oslo use all-sky. AERONET clear-sky AOD observations as annual mean of the year 2010 are illustrated as coloured circles. Right: Scatter plots of modelled AOD against AERONET (monthly average) observations (b, d, f, h).
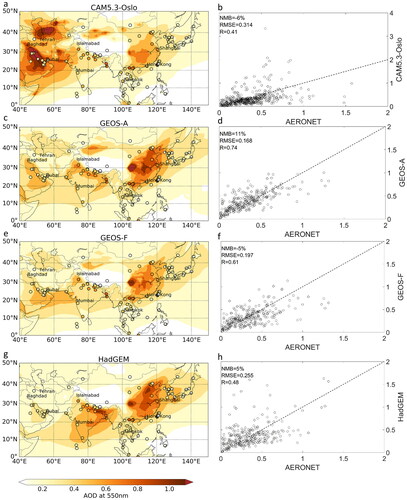
Fig. 5. Left: Annual mean of the year 2010 of absorption aerosol optical depth (AAOD) for four AeroCom phase III models in the focus region (a, c, e, g). Note, HadGEM uses a clear-sky AOD while GEOS and CAM5.3-Oslo use all-sky. AERONET clear-sky AAOD observations as annual mean of the year 2010 are illustrated as coloured circles. Right (b, d, f, h): Scatter plots of modelled AAOD against AERONET observations (monthly average).
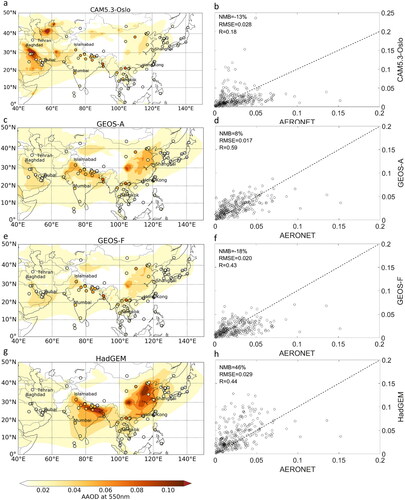
Table 4. Mean AAOD, normalised mean bias (NMB) and correlation (R) compared to AERONET, aerosol emissions, column burden and residence times for absorbing aerosols for MERRA-2 and AeroCom phase III models on the regional scale for the year 2010.
Fig. 6. Absolute differences in AAOD between the nudged model control simulation and the model sensitivity experiments in the categories ’Emissions’ (a, b), ’Meteorology’ (c, d), ’Optics’ (e, f, g) as well as one combined sensitivity experiment (h) for the year 2010 in the focus region.
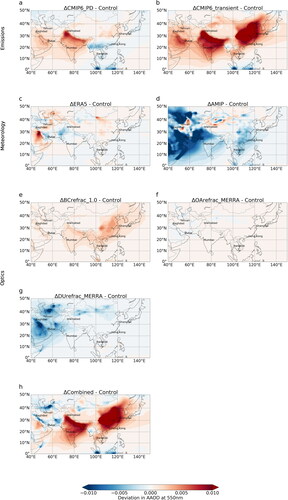
Fig. 7. AAOD seasonal variability for the year 2010 from the AMIP and nudged control simulations compared to AeroCom phase III models and AERONET AAOD monthly means (Level 1.5). The blue shaded area indicates the range of AAOD changes for all sensitivity experiments. The map in the bottom left corner shows the respective locations of the AERONET stations.

Fig. 8. Regionally averaged AAOD for the control simulation, sensitivity experiments as well as MERRA-2 and the AeroCom phase III models. The error bars show the inter-quartile range. The regions are (a) the focus region Asia, (b) India, (c) East China and (d) Arabia.
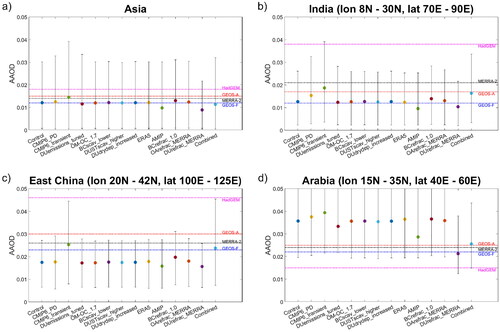
Table 5. Absolute regional mean in AAOD for the year 2010, the normalised mean bias (NMB, in %) and correlation (R) compared to AERONET data.
Data availability statement
Data produced with model simulations using the model CAM5.3-Oslo is available from the corresponding author upon request. Observational data from AERONET and MODIS as well as the MERRA-2 reanalysis is openly available. AeroCom model output is available via the AeroCom archive.