
Figures & data
Figure 1. PRISMA (The Preferred Reporting Items for Systematic Reviews and Meta-Analyses) flow diagram of the study selection process. Abbreviations: AML, acute myeloid leukemia.
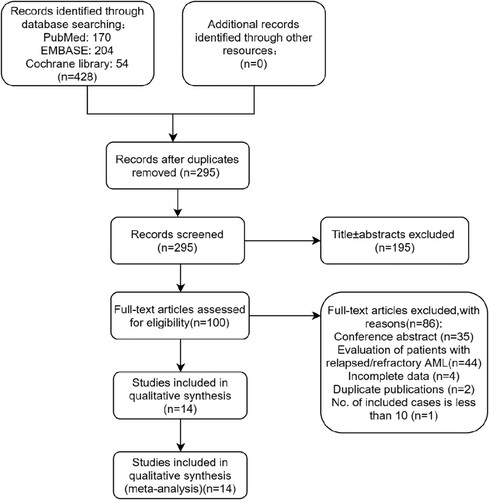
Table 1 Characteristics of the included studies
Table 2 Characteristics of the included studies
Figure 2. A forest graph showing the overall and subgroup CR rates achieved in the meta-analysis. Abbreviations: DAC, daunorubicin, Ara-C, and cladribine; IAC, idarubicin, Ara-C, and cladribine; CLAG ± M, cladribine, Ara-C, G-CSF ± mitoxantrone.
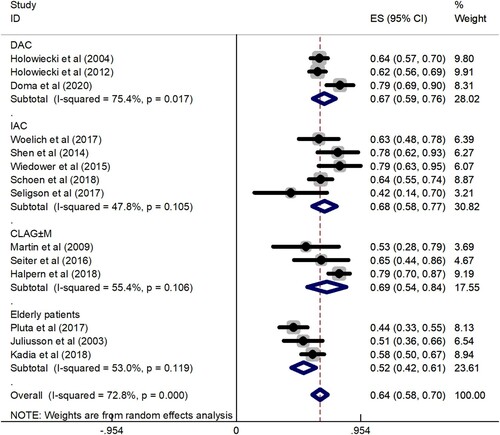
Figure 3. A forest graph showing the comparison of the CR rate between the cladribine-containing regimen and the control group. Abbreviations: DAC, daunorubicin, Ara-C, and cladribine; IAC, idarubicin, Ara-C, and cladribine; CLAG ± M, cladribine, Ara-C, G-CSF ± mitoxantrone; DA, daunorubicin and Ara-C; IA, idarubicin and Ara-C.
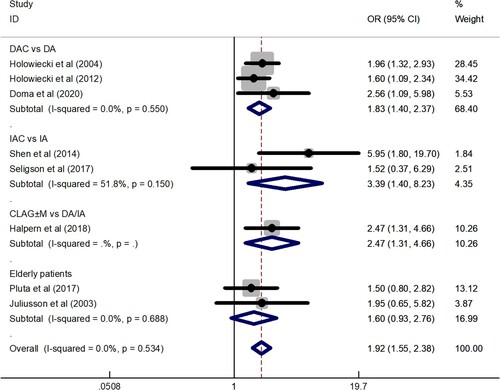
Figure 4. A forest graph showing the overall and subgroup ED rates achieved in the meta-analysis. Abbreviations: DAC, daunorubicin, Ara-C, and cladribine; IAC, idarubicin, Ara-C, and cladribine; CLAG ± M, cladribine, Ara-C, G-CSF ± mitoxantrone.
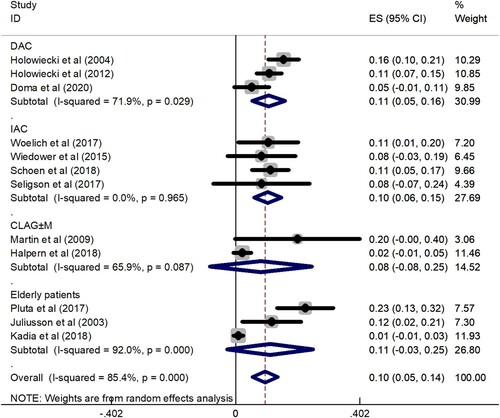
Figure 5. A forest graph showing the comparison of the ED rate between the cladribine-containing regimen and the control group. Abbreviations: DAC, daunorubicin, Ara-C, and cladribine; IAC, idarubicin, Ara-C, and cladribine; CLAG ± M, cladribine, Ara-C, G-CSF ± mitoxantrone; DA, daunorubicin and Ara-C; IA, idarubicin and Ara-C.
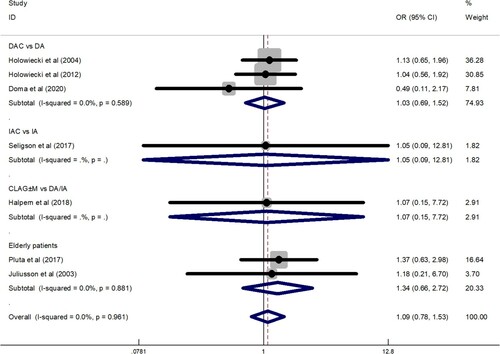
Figure 6. Begg’s funnel plot for assessing publication bias.
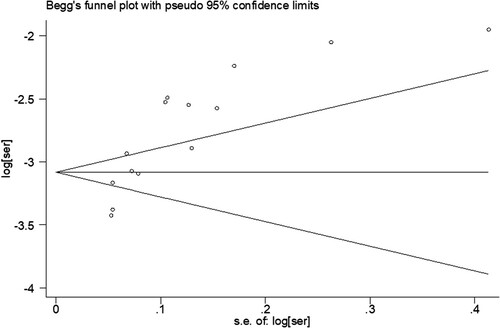
Table 3 Risk of bias in the prospective randomized controlled studies
Table 4 Risk of bias in retrospective studies using a modified Newcastle-Ottawa scale