Figures & data
Figure 1. Relative expression level of the c-CBL gene in healthy donors and refractory or relapsed patients
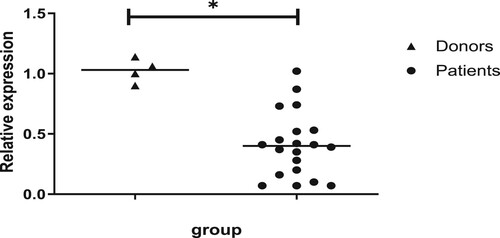
Table 1. Characteristics of patients and donors.
Figure 2. Cell proliferative activity was affected by c-CBL gene expression. Compared with that of the control and negative (silenced) control group cells, the proliferative activity of HL60 (A) and THP1 (B) cells with c-CBL gene silencing was slightly increased. Under similar conditions, the proliferation of HL60 (C) and THP1 (D) cells decreased when the c-CBL gene was overexpressed. (For details, see the supplementary materials.)
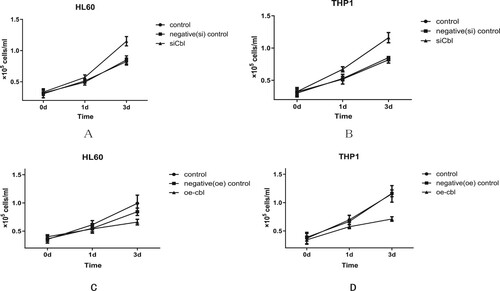
Figure 3. The proliferation-promoting effect of SCF on HL60 cells with different c-CBL expression statuses. HL60 cells with different c-CBL gene expression statuses (A and B) were stimulated with SCF (10 ng/ml) for 24 h. Compared with that of each corresponding nonstimulated group, increasing OD values were observed in every stimulated (SCF) group, and the differences in each pair were statistically significant. In addition, regardless of the presence of the stimulus, the OD values were negatively associated with the c-CBL gene status. That is, the lower the c-CBL gene expression was, the higher the OD values were. During the whole observation period from Days 1–5, the OD values of the c-CBL silencing group were higher than those of any other group after SCF stimulation (for details, see the supplementary materials).
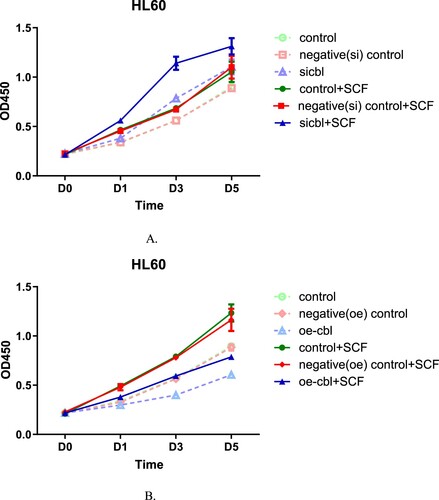
Figure 4. The proliferation-promoting effect of SCF on THP1 cells with different c-CBL expression statuses. THP1 cells with different c-CBL gene expression statuses (A and B) were stimulated with SCF (10 ng/ml) for 24 h. The results were similar to those of HL60 cells; regardless of the presence of SCF, the OD values were associated with the cellular c-CBL gene status. That is, the lower the c-CBL gene expression was, the higher the OD values were. During the whole observation period from Days 1–5, the OD values of the c-CBL silencing group were higher than those of any other group after SCF stimulation (for details, see the supplementary material).
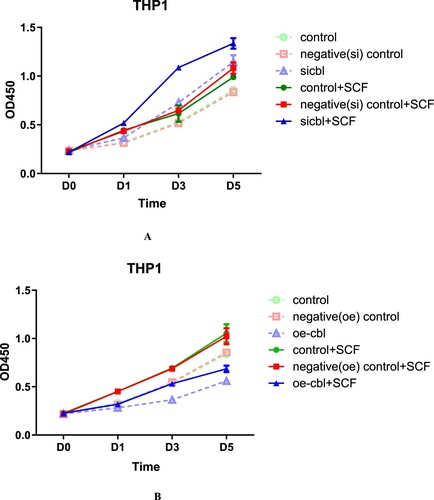
Figure 5. Percentage of HL60 (A) and THP1 (B) cells in different cell cycle phases after c-CBL gene silencing (si) and overexpression (oe) (for details, see the supplementary materials).
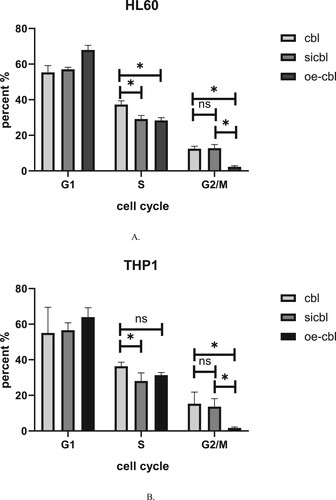
Figure 6. Apoptosis of HL60 (A) and THP1 (B) cells with different c-CBL gene statuses treated with cytarabine or sorafenib for 24 h. FACS was used to test the apoptotic cell ratio with Annexin V-FITC/PI double staining, and the results were averaged from three independent experiments. (For details, see the supplementary materials.)
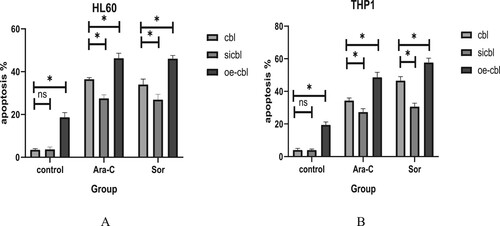
Figure 7. Growth inhibition of HL60 cells with different c-CBL gene statuses treated with sorafenib for 24 h. The IC50 values were calculated by the CCK-8 colorimetric method. The results showed that the sorafenib IC50 concentration was increased with the downregulation of c-CBL gene expression and decreased upon c-CBL gene overexpression.
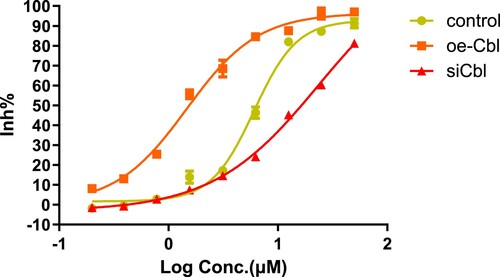
Figure 8. Growth inhibition of THP1 cells with different c-CBL gene statuses treated with sorafenib for 24 h. Under the same conditions, the IC50 values of sorafenib in THP1 cells were similar to those in HL60 cells and were also affected by c-CBL gene status.
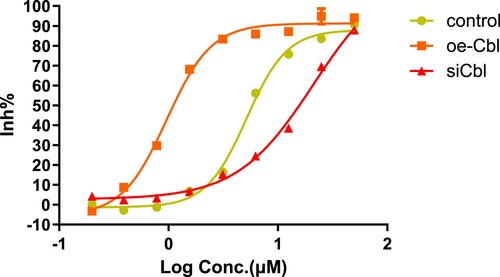
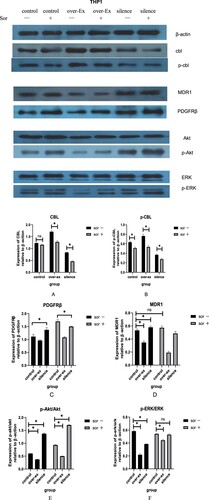
Figure 9. Related protein expression in HL60 cells with different c-CBL gene statuses with or without sorafenib(10μM) treatment for 24 h.
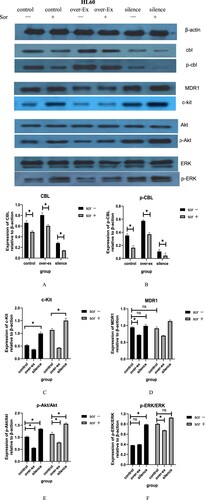
Figure 10. Related protein expression in THP1 cells with different c-CBL gene statuses with or without sorafenib(10μM) treatment for 24 h.