
Figures & data
Table 1. Summary of hypotheses/assumptions.
Table 2. “How important do you think various issues should be for NIF and Norwegian sport clubs?”. Percentages. N = From 1082 to 1096.
Table 3. Independent variables.
Table 4. OLS-regression. Dependent variable; Index 0-10. How many problem-issues do each person see as “very important” (see ). Coefficients (standard errors). *p < .05, **p < .01, ***p < .001.
Figure 1. Index showing how many problem-issues each respondent report as “very important”. N = 1082 to 1096.
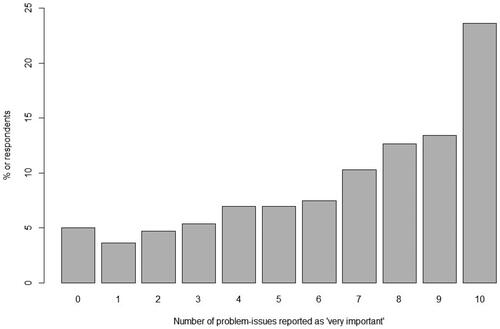
Figure 2. Percentage reporting each problem-issue as ‘very important’. N = 1082 to 1096.
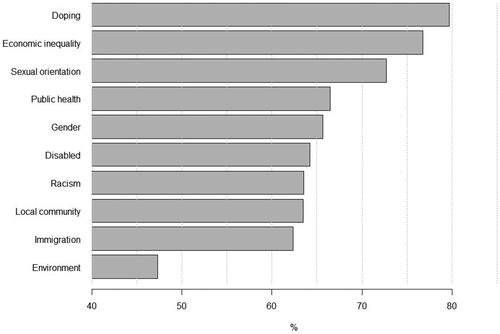
Figure 3. Regression coefficients (AME) for (a) gender and (b) sports affiliation for each of sports political issue. Dots are values for AME regression coefficient, dotted lines indiate two standard deviations distance from regression coefficient values.
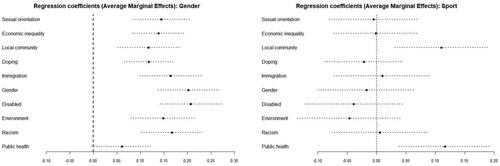
Figure 4. Regression coefficients (AME) for (a) Socialist Party, (b) Centre Party and (c) Progress Party for each of sports political issue. Dots are values for AME regression coefficient, lines indiate two standard deviations distance from regression values.
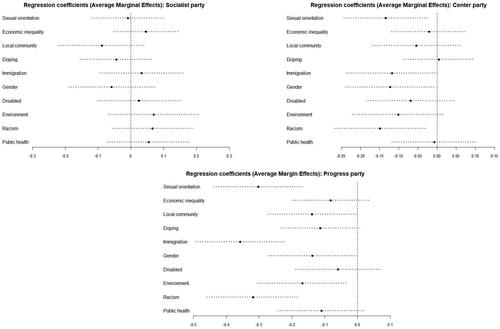
Table A1. Logistic regression. Dependent variable: “How important do you think that various issues should be for NIF and Norwegian sports clubs?” Respondents say this is “very important” versus those with other answers. Coefficients and standard errors. *p < 0.1; **p < 0.05; ***p < 0.01.