Figures & data
Table 1. The free-radical scavenging activity of different fractions of T. chebula fruit and ascorbic acid (positive control).
Figure 1. (a) Inhibitory effect of T. chebula fractions on plasmid DNA nicking. Lane 1 – DNA (pEGFP-C1 plasmid alone); Lane 2 – DNA and Fenton reagent; Lane 3 – DNA, Fenton reagent and Chloroform–Acetone 1:4; Lane 4 – DNA, Fenton reagent and Ethyl acetate–Ethanol 6:1; Lane 5 – DNA, Fenton reagent and Hexane–Ether 1:4; Lane 6 – DNA, Fenton reagent and Ether–Acetone 1:1; Lane 7-DNA, Fenton reagent and Methanol–Water 1:1. (b) Band intensity of Circular, Linear and Relaxed forms. Lane 1 – DNA (pEGFP-C1 plasmid alone); Lane 2 – DNA and Fenton reagent; Lane 3 – DNA, Fenton reagent and Chloroform–Acetone 1:4; Lane 4 – DNA, Fenton reagent and Ethyl acetate–Ethanol 6:1; Lane 5 – DNA, Fenton reagent and Hexane–Ether 1:4; Lane 6 – DNA, Fenton reagent and Ether–Acetone 1:1; Lane 7-DNA, Fenton reagent and Methanol–Water 1:1.
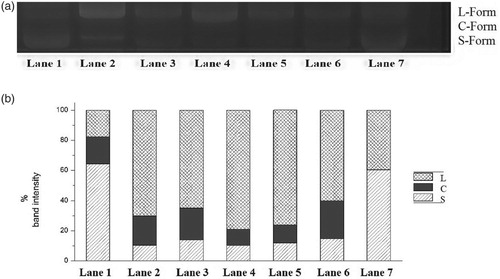
Table 2. % inhibition activity of different fractions at 20 µg/ml concentration.
Figure 2. UV–Vis spectrum of the compound.
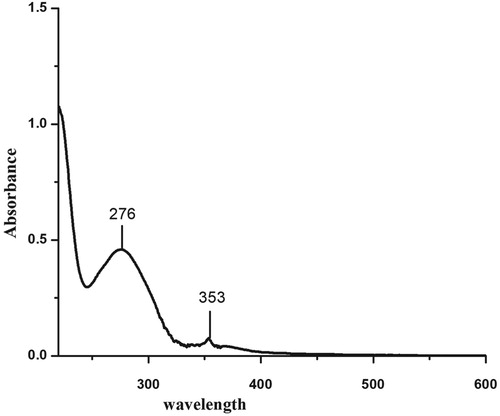
Figure 3. FT-IR spectrum of the compound.
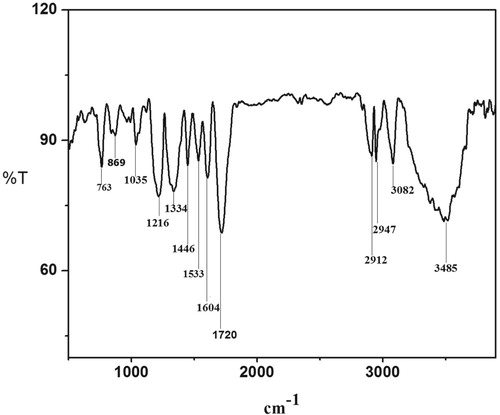
Figure 4. 1H NMR spectrum of the compound.
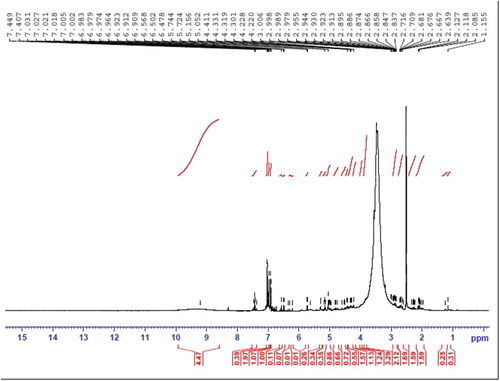
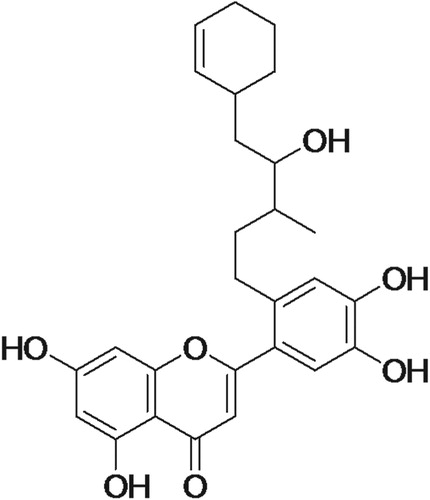
Figure 5. Chemical structure of the compound.
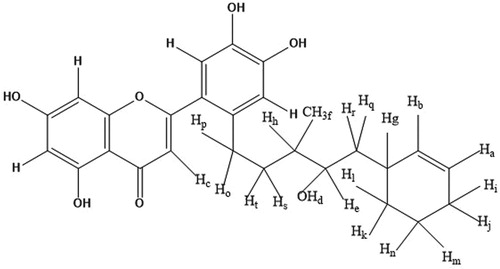
Table 3. Description of mass spectrum.
Figure 6. Chemical structure of the compound isolated from T. chebula. 2-(2-(5-(cyclohex-2-enyl)-4-hydroxy-3-methylpentyl)-4,5-dihydroxyphenyl)-5,7-dihydroxy-4H-chromen-4-one.