Figures & data
Figure 1. Relationship between the given doses of selenium (0, 4.5, 9, and 18 mg/kg body weight) and (a) the levels of malondialdehyde (MDA) and (b–d) the activities of antioxidant enzymes (CAT, SOD, and GPx) in rats after 12 h (blue line) and 30 h (red line). r, Spearman’s correlation coefficient; *, significant correlation.
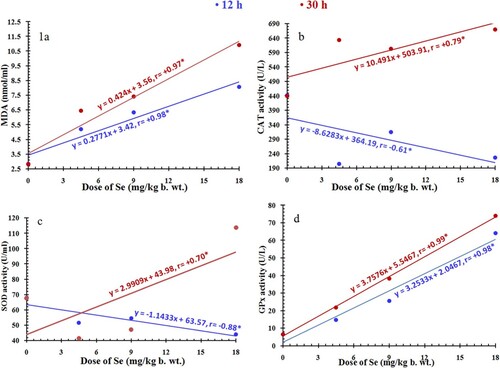
Table 1. Effect of vitamin E on serum levels of malondialdehyde (MDA) and plasma levels of catalase (CAT), superoxide dismutase (SOD), and glutathione peroxidase (GPx) activities in selenium-treated rats (n = 6).
Figure 2. Relationship between the given doses of selenium (0, 4.5, 9, and 18 mg/kg body weight) and the activities of liver enzymes, AST, ALT, and GGT (a–c) in rats after 12 h (blue line) and 30 h (red line). r, Spearman’s correlation coefficient; *, significant correlation.
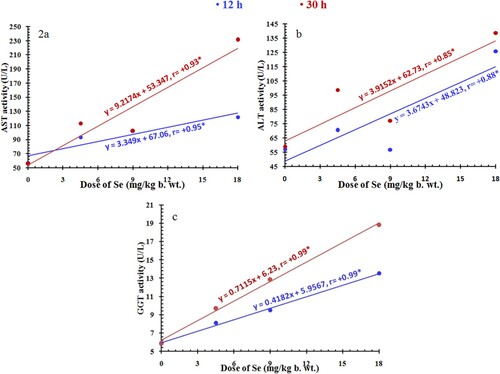
Table 2. Effect of vitamin E on serum levels of aspartate (AST), alanine (ALT) aminotransferases, and γ-glutamyltransferase (GGT) activities in selenium-treated rats (n = 6).
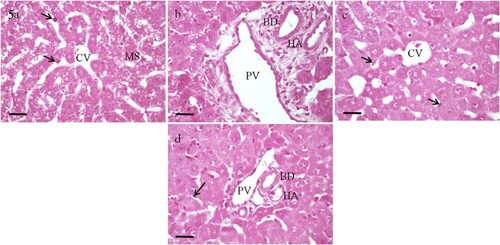
Figure 3. Photomicrographs of sections of the liver of rats. (a and b) A control rat showing normal structure and organization. (c to f) Rats administrated with 0.25 LD50 of selenium. (g to j) Rats administrated with 0.5 LD50 of selenium. (c and d) After 12 h, the liver parenchymal cells appear almost normal. (e and f) After 30 h, microvesicular steatosis (MS) is seen in most hepatocytes. Feathery degeneration (FD) is evident in the periportal area. (g and h) After 12 h, the central vein (CV) and the portal vein (PV) appear slightly dilated and congested. (i and j) After 30 h, the central vein and the portal vein are markedly dilated and congested. PN, pyknotic nucleus; HS, hepatic sinusoids; FC, fatty change; HA, branch of hepatic artery; BD, branch of bile duct. H&E, scale bar = 50 µm.
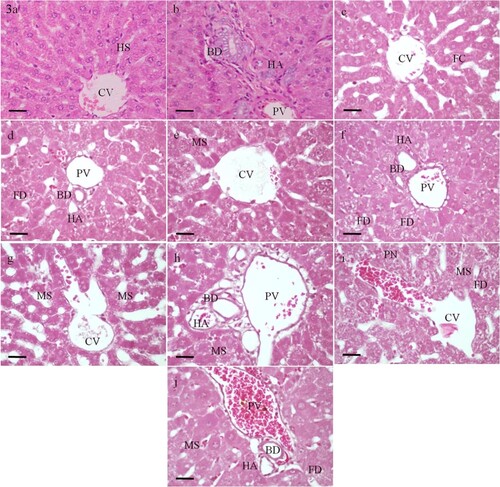
Figure 4. Photomicrographs of sections of the liver obtained from rats 12 h (a to d) and 30 h (e to h) post administration with LD50 of selenium showing loss of sinusoidal architecture and diffused hemorrhage (H). Marked dilation and congestion of the central vein (CV) and the portal vein (PV) are observed. Bile duct (BD) proliferation is recognized. Marked microvesicular steatosis (MS), and pyknotic (PN) and karyorrhectic nuclei (arrow) are evident. HA, branch of hepatic artery. H&E, scale bar = 50 µm.
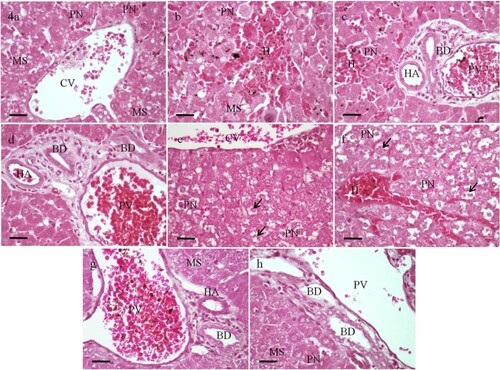
Figure 5. Photomicrographs of sections of the liver of rats received both vitamin E and a single LD50 of selenium, and sacrificed either after 12 h (a and b) or 30 h (c and d). Normal hepatic structure and organization are nearly appeared particularly after 30 h. The hepatocytes reveal regression in fatty and necrotic changes with no or little vacuoles and pyknosis. Portal triads are seen with almost normal appearance. Numerous Kupffer cells (arrow) are noticed. MS, microvesicular steatosis; CV, central vein; PV, branch of portal vein; HA, branch of hepatic artery; BD, branch of bile duct. H&E, scale bar = 50 µm.