Figures & data
Table 1. Effect of HP on serum ALT, AST, and ALP levels in OLZ-administered rats.
Table 2. Effect of HP on liver oxidative stress and antioxidant enzymes activity of OLZ-administered rats.
Table 3. Effect of HP on serum triglyceride, cholesterol, and glucose of OLZ administered rats.
Table 4. Effect of HP on body weight gain of OLZ administered rats.
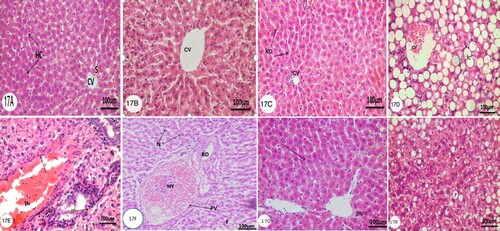
Figure 1. Photomicrographs of transverse section (T. S) (5 µm) of liver of rats of control group, HP-administered group, OLZ-administered group, and animal treated with OLZ and HP. Characteristic figures were stained with H&E. The original magnification was x100. (A and B) Control group, Arrow, (CV) and (S) indicate normal hepatic cell, central vein, and sinusoids, respectively. (C) Animals treated with 81.0 mg/kg /day HP three times a week for 4 weeks. Illustrating normal Kupffer Cells (KC) lining the sinusoids. (D, E, and F) animals treated with 27.0 mg/kg/day OLZ daily for 6 weeks showing severe fatty changes (FC) and dilated congested central vein (CV) hyperemic dilated portal vein (HY), bile duct (BD) and necrotic cells (N). In addition to inflammatory cells infiltration (IF) in the portal areas and dilated portal vein (pv) with arrow refers to swelling endothelium. (G and H) rats were given OLZ at a dose of 27.0 mg/kg/day for 6 weeks plus with HP at a dose of 81.0 mg/kg/day three times a week for last 4 weeks revealing normal hepatic parenchyma indicated by an arrow without fatty changes and dilated portal vein (PV).