
Figures & data
Figure 1. Structural representations of the five cannabinoid 2 receptor inhibitors from the current dataset with the highest and lowest activity.
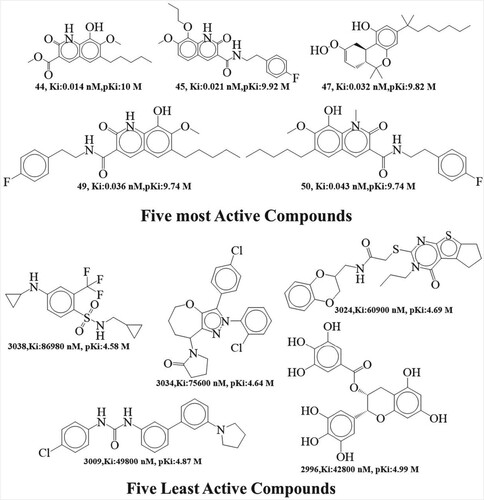
Table 1. Different molecular descriptors present in Model-A, Model-B, Model-C and their description.
Figure 2. Plot of the number of descriptors against leave-one-out coefficient of determination Q2LOO to identify the optimum number of descriptors.
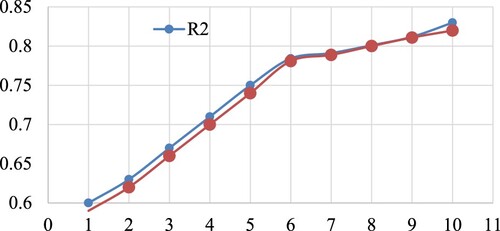
Figure 3. Different graphs related to model-A (A) Experimental vs Predicted pKi values (the solid line represent the regression line); (B) Residual Plot for experimental vs residuals; (C) Williams’s plot for applicability domain (the vertical solid line represents h* = 0.020 and horizontal dashed lines represent the upper and lower boundaries for applicability domain); (D) In-Subira plot for the applicability domain analysis.
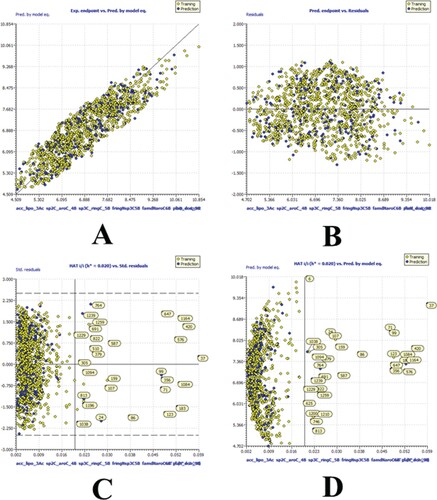
Figure 4. Different graphs related to model-B (A) Experimental vs Predicted pKi values (the solid line represent the regression line); (B) Residual Plot for experimental vs residuals; (C) Williams’s plot for applicability domain (the vertical solid line represents h* = 0.0320 and horizontal dashed lines represent the upper and lower boundaries for applicability domain); (D) In-Subira plot for the applicability domain analysis.
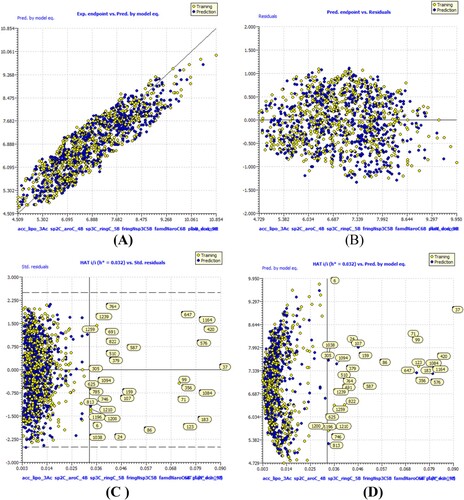
Figure 5. Different graphs related to model-C (A) Experimental vs Predicted pKi values (the solid line represent the regression line); (B) Residual Plot for experimental vs residuals; (C) Williams’s plot for applicability domain (the vertical solid line represents h* = 0.0320 and horizontal dashed lines represent the upper and lower boundaries for applicability domain); (D) In-Subira plot for the applicability domain analysis.
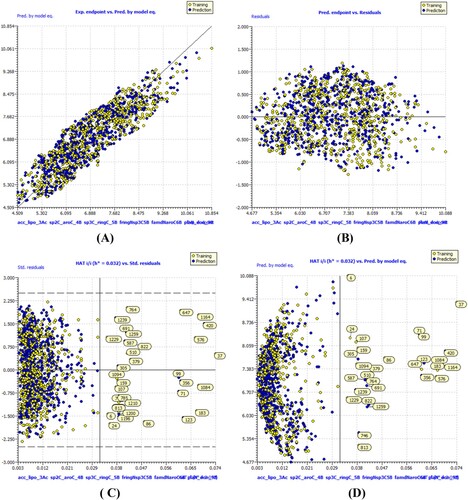
Table 2. Depiction of the Docking Score and RMSD values for pdb:5zty ligand and the top 10 most active compounds.
Figure 6. Depiction of the molecular descriptor acc_lipo_3Ac for the compounds 8 and 255 only. Presentation of the 2D interaction with CB2R and pharmacophore model for the compound 8.
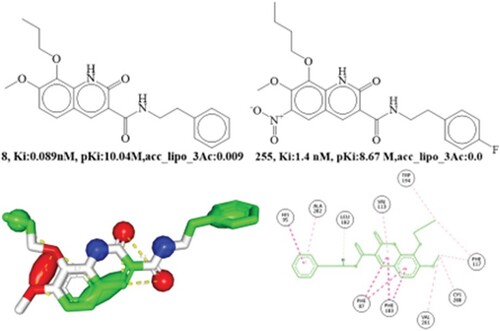
Figure 7. Presentation of molecular descriptor sp2C_aroC_4B for the compounds; 45 and 216. Depiction 2D interaction and Pharmacophore model for the compound 45.
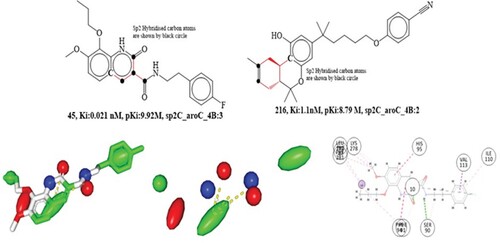
Figure 8. Depiction of the molecular descriptor sp3C_ringC_5B for the compounds 50 and 255 only (Black dot indicates sp3 hybridized carbon atoms). Presentation of 2D and 3D interactions of compound 50 with the cannabinoid receptor. The pharmacophore model for the compound 50 (blue-donor, red-acceptor and green hydrophobic)
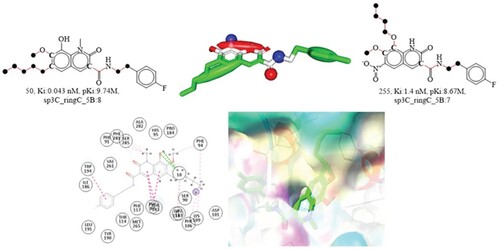
Figure 9. Depiction of the molecular descriptor fringNsp3C5B for the compounds 16 and 909 (Black dot indicates sp3 hybridized carbon atoms). Depiction of 2D and 3D interactions of compound 16 with cannabinoid 2 receptor.
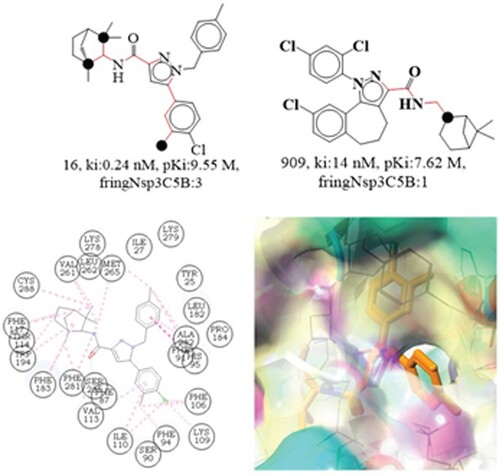
Figure 10. Presentation of the molecular descriptor famdNaroC6B for the molecule 1283 and 176 only.
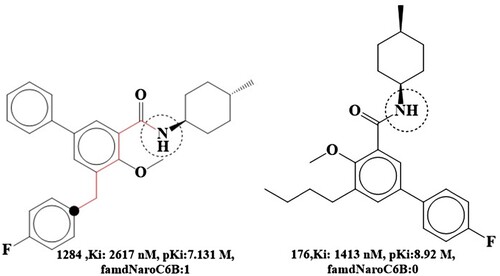
Figure 11. Presentation of the molecular descriptor plaN_don_9B for the compounds 118 and 161 only.
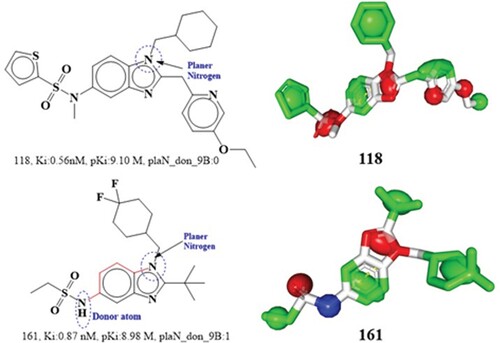
Table 3. Depiction of the average value from replicate runs of MD simulation parameters such as; RMSD, RMSF, and ROG (Radius of gyration).
Figure 12. A. MD simulation trajectory analysis of RMSD of compound 8 bound with 5zty, 100 ns time frame in triplicate displayed: R1 (replicate 1) RMSD plot of compound 8 bound cannabinoid 2 receptor (PDB I.D: 5zty) (navy blue); R2 (replicate 2) RMSD plot of compound 8 bound cannabinoid 2 receptor (PDB I.D: 5zty)(peacock green); R3 (replicate 2) RMSD plot of compound 8 bound cannabinoid 2 receptor (PDB I.D: 5zty)(ash color); B. RMSF analysis of compound 8 bound cannabinoid 2 receptor (PDB I.D.: 5zty). R1 (replicate 1) H-bond plot of compound 8 bound cannabinoid 2 receptor (Green). R2 (replicate 2) compound 8 bound cannabinoid 2 receptor (PDB I.D.: 5zty) (dark grey). R2 (replicate 2) compound 8 bound cannabinoid 2 receptor (PDB I.D.: 5zty) H-bond plot of compound 8 bound cannabinoid 2 receptor (dark red); R3 (replicate 3) compound 8 bound cannabinoid 2 receptor (PDB I.D.: 5zty); C.R1 (replicate 1) ROG plot of compound 8 bound cannabinoid 2 receptor (PDB I.D.: 5zty) (light pink); R2 (replicate 2) ROG plot of compound 8 bound cannabinoid 2 receptor (PDB I.D.: 5zty) (parrot green); R3 (replicate 3) ROG plot of compound 8 bound cannabinoid 2 receptor (PDB I.D.: 5zty) (peacock gold); H-bond plot of compound 8 bound cannabinoid 2 receptor (chocolate color); D. R1 (replicate 1) RMSF plot of compound 8 bound cannabinoid 2 receptor (PDB I.D.: 5zty) (olive red); R2 (replicate 2) RMSF plot of compound 8 bound cannabinoid 2 receptor (PDB I.D.: 5zty) (cream); R3 (replicate 3) RMSF plot of compound 8 bound cannabinoid 2 receptor (PDB I.D.: 5zty) (peacock pale peacock green).
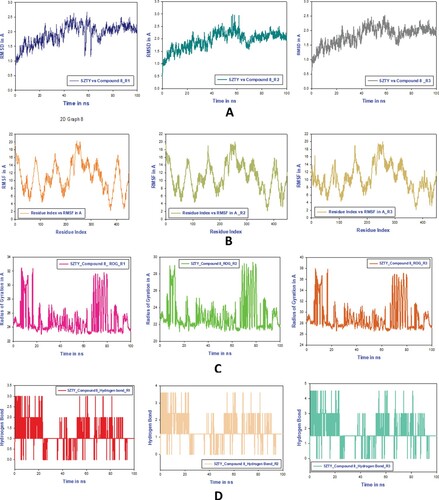
Table 4. Binding energy calculation of compound 8 with cannabinoid 2 receptor protein and non-bonded interaction energies from MMGBSA trajectories.
Supplemental Material
Download MS Excel (208 KB)Supplemental Material
Download MS Excel (759 KB)Supplemental Material
Download MS Word (49.5 KB)Supplemental Material
Download MS Excel (71.4 KB)Supplemental Material
Download MS Excel (159.3 KB)Data availability statement
All the data available on this manuscript.