
Figures & data
Figure 1. The Merck family of fertility pen injectors: the multi-dose r-hFSH pen injector 2.0 900 IU presentation (a), the r-hCG pen injector 1.0 (b) and the r-hFSH:r-hLH 2:1 combination pen injector 2.0 900 IU + 450 IU presentation (c). This figure is reprinted with permission of Merck KGaA, Darmstadt, Germany, who own the copyright of the images.
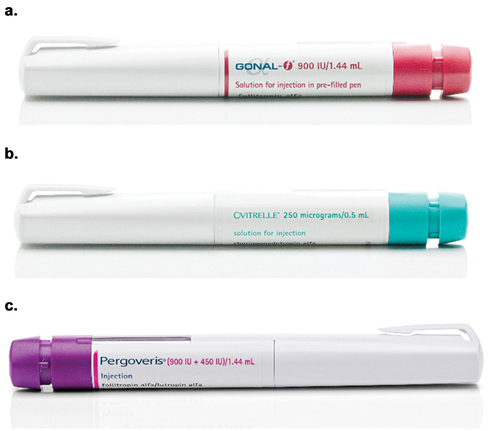
Table 1. r-hFSH pen injector 2.0, r-hFSH:r-hLH 2:1 combination pen injector 2.0 and r-hCG pen injector 1.0 target dose volume, and lower and upper specified limits, for each dial setting assessed (Studies 1–5).
Figure 2. Summary diagram of Vmin, Vmid, Vmax for r-hFSH pen injector 2.0 (a) 150 IU*, (b) 300 IU†, (c) 450 IU†, (d) 900 IU† (Study 1A, aubonne, Switzerland and Study 1B, Bari, Italy). The orange lines/dots represent the upper specification limits, and the gray lines/dots represent the lower specification limits. Error bars are calculated as ktar*SD. *Final assembly at the Merck Biopharma production plant at Bari, Italy. †Final assembly at the Merck Biopharma production plant at aubonne, Switzerland.
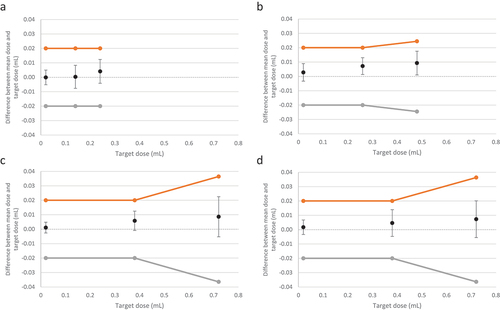
Table 2. The r-hFSH pen injector 2.0 mean actual doses and deviations from target dose (Study 1A, Aubonne, Switzerland and Study 1B, Bari, Italy).
Table 3. Mean actual doses and deviations from target dose for r-hCG pen 1.0 injector (Study 2, Bari, Italy [D1 device classification] and Study 3, aubonne, Switzerland [D2 device classification]).
Figure 3. Summary diagram of Vmin, Vmid, Vmax for the r-hCG pen injector 1.0 (D2 device classification: single use/variable dose device) (Study 3, Aubonne, Switzerland). The orange lines/dots represent the upper specification limits, and the gray lines/dots represent the lower specification limits. Error bars are calculated as ktar*SD. Device tested at the Merck Biopharma production plant at Bari, Italy.
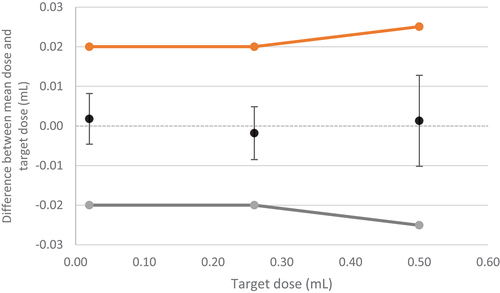
Figure 4. Summary diagram of Vmin, Vmid, Vmax for the r-hFSH:r-hLH 2:1 combination pen injector 2.0 (A) 900:450 IU, (B) 450:225 IU, (C) 300:150 IU (Study 4, Bari, Italy). The orange lines/dots represent the upper specification limits, and the gray lines/dots represent the lower specification limits. Error bars are calculated as ktar*SD. Devices tested at the Merck Biopharma production plant at Bari, Italy.
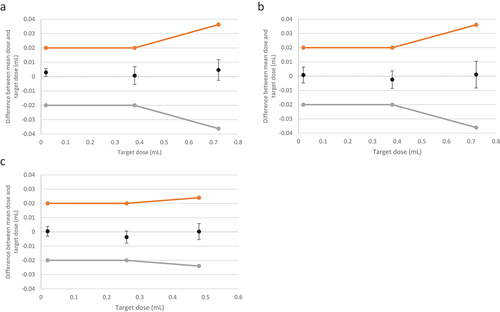
Table 4. Mean actual doses and deviations from target dose for r-hFSH:r-hLH 2:1 combination pen injector 2.0 (Study 4, Bari, Italy).
Table 5. Mean actual doses and deviations from target dose for r-hFSH:r-hLH 2:1 combination pen injector 2.0 (Study 5, Aubonne, Switzerland).