
Figures & data
Figure 1. Potential modes of action of idiosyncratic adverse drug reactions. Idiosyncratic hepatotoxicity can arise either from altered drug disposition resulting in greater than normal exposure to a drug or its toxic metabolite(s) or from a change in toxicodynamics that leads to a reduction in the threshold for toxicity.
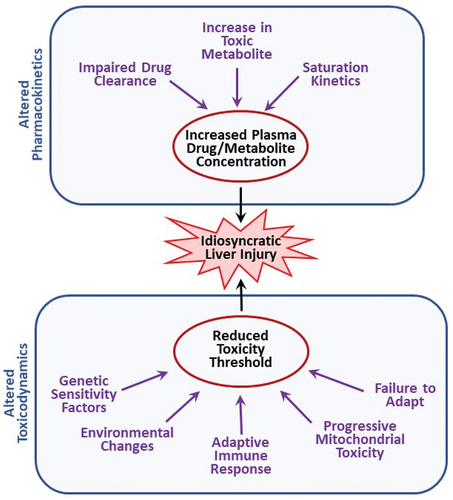
Figure 2. Drug plasma concentration during maintenance therapy. When drugs are taken over an extended period, the usual goal is to maintain plasma drug concentrations above the minimum effective concentration but below the threshold for toxicity. This is accomplished by administering the drug repeatedly at the same dose and dosing interval. Initially, the concentration of drug in blood is small but increases with each dose until the amount of drug eliminated during a dosing interval equals the next dose. A plateau (steady state) in the concentration of drug in plasma is thereby achieved. Solid line depicts drug concentration in plasma; blue dashed line indicates the plasma concentration below which the drug is ineffective; red dashed line represents the plasma concentration above which toxicity occurs (i.e. the threshold for toxicity).
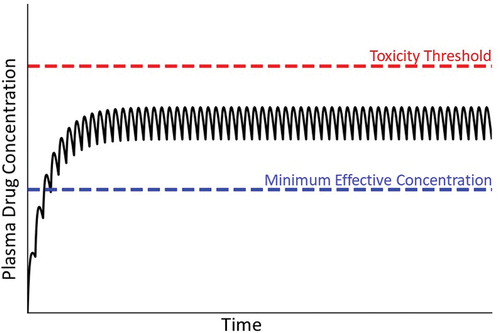
Figure 3. Michaelis-Menten kinetics and drug concentration in plasma over time under the condition of zero-order kinetics. A. Michaelis-Menten kinetics. As the concentration of drug increases above zero, the velocity of the reaction (V, metabolism rate) increases. When the drug concentration is substantially smaller than Km (the drug concentration at half-maximal V), first-order kinetics apply (i.e. metabolism rate is proportional to drug concentration). At concentrations much larger than Km (i.e. at Vmax), zero-order kinetics occur (i.e. metabolism rate is constant and independent of drug concentration). At concentrations near Km, a transition from first- to zero-order will occur in vivo as plasma drug concentration increases, because first-order kinetics no longer apply. B. Transitional kinetics. When approaching saturation kinetics during maintenance therapy, the dose of drug taken during the dosing interval exceeds the ability to eliminate (e.g. metabolize) the dose within the dosing interval. This results in increasing plasma concentration of drug with time and a failure to attain a steady state (plateau). Ultimately, plasma drug concentration exceeds the threshold for toxicity, and an adverse reaction occurs.
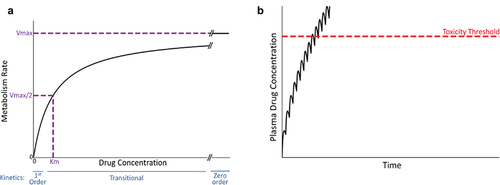
Figure 4. Plasma drug concentration over time under conditions in which the drug concentration exceeds the toxicity threshold. Panel A represents a situation in which the patient’s metabolism or transport capabilities are compromised before the start of therapy; in this case, the plasma drug concentration can exceed the threshold for toxicity, resulting in an early onset of injury (violet dashed line). Panel B represents a decrease in the patient’s drug metabolism or excretion during maintenance therapy. In this case, plasma drug concentration rises and has the potential to exceed the toxicity threshold. A new, elevated steady state plasma concentration will ultimately be established (not shown).
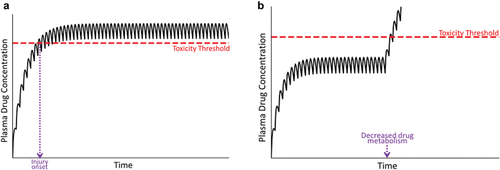
Figure 5. Plasma concentration of parent drug and its metabolite over time. Toxicity thresholds are shown for both parent compound (red dashed line) and metabolite (violet dashed line). Panel A represents the desired therapeutic condition in which the plasma concentration of parent drug as well as its metabolite(s) (blue line) remain below their respective toxicity thresholds. Panel B represents the condition in which the concentration of the metabolite exceeds its toxicity threshold, in this case due to induction of CYP during maintenance therapy, prompting an adverse reaction.
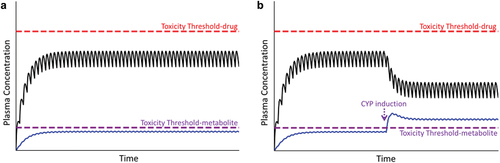
Figure 6. Concentration of drug in plasma during maintenance therapy under condition in which a patient’s toxicity threshold is low relative to the majority of patients. As mentioned in the text, a variety of factors can lead to a reduced toxicity threshold for an individual. Without prior knowledge of this, normal maintenance therapy could lead to concentrations of drug in plasma that exceed the lower-than-normal toxicity threshold (compare to ).
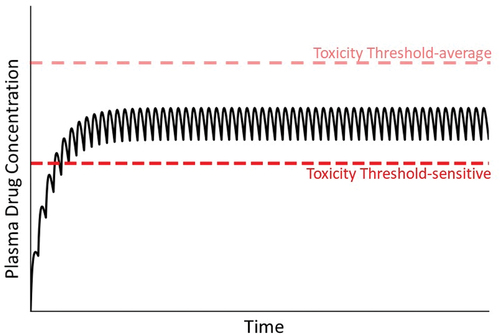
Figure 7. Drug concentration in plasma over time under condition in which the toxicity threshold decreases progressively. As mentioned in the text, mitochondrial dysfunction and other factors can lead to a gradual decrease in the toxicity threshold within an individual. As such, at some time the threshold can fall below the steady state plasma concentration, leading to overt injury.
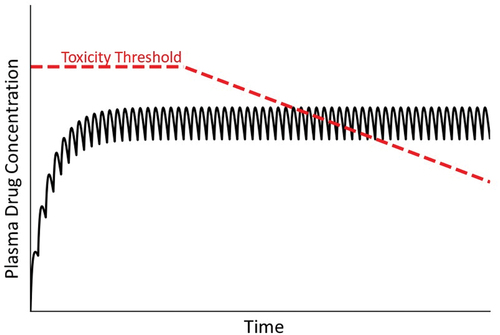
Figure 8. Concentration of drug in plasma over time under condition of a variable toxicity threshold. As mentioned in the text, the toxicity threshold might not be constant but rather subject to a variety of factors that could change it over time. In this illustration, the variable toxicity threshold falls below the steady state concentration of drug in plasma, at which time an IDILI reaction occurs.
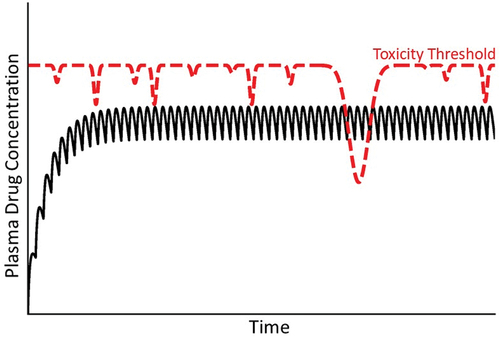
Figure 9. Concentration of drug in plasma over time under conditions of an adaptive immune response. In this illustration, a patient’s usual toxicity threshold is above the concentration of drug in plasma. When a damaging adaptive immune response ensues, a new toxicity threshold applies that falls rapidly below the steady state plasma concentration. The normal toxicity threshold (red dashed line) is established by intrinsic properties of the drug, whereas the lower toxicity threshold (violet dashed line) is controlled by a different mechanism driven by the adaptive immune response.
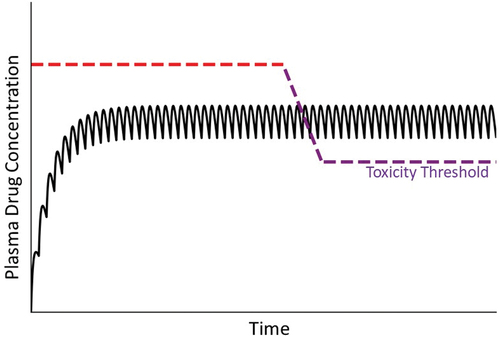
Figure 10. Drug concentration in plasma under condition in which a patient either adapts or fails to adapt to minor, drug-induced injury. Many drugs cause a minor degree of liver injury (depicted as an intersection of plasma drug concentration line with a low toxicity threshold [red dashed line]) to which most patients respond with adaptation (pictured as an elevation in toxicity threshold [green dashed line]) during continued drug treatment. Some patients do not adapt, so that plasma drug concentration remains above the toxicity threshold (red dashed line), resulting in continued and worsening liver damage.
![Figure 10. Drug concentration in plasma under condition in which a patient either adapts or fails to adapt to minor, drug-induced injury. Many drugs cause a minor degree of liver injury (depicted as an intersection of plasma drug concentration line with a low toxicity threshold [red dashed line]) to which most patients respond with adaptation (pictured as an elevation in toxicity threshold [green dashed line]) during continued drug treatment. Some patients do not adapt, so that plasma drug concentration remains above the toxicity threshold (red dashed line), resulting in continued and worsening liver damage.](/cms/asset/db1dfa5b-59c4-49f8-9335-2612e82d6202/iemt_a_2113379_f0010_oc.jpg)