Figures & data
Figure 1. Effects of P. indica colonization on rice growth and photosynthesis under rice leaffolder infestation conditions. The 4-leaf-stage P. indica-inoculated and noninoculated plants were treated with rice leaffolder larvae. The phenotype (A), biomass of shoots (C) and roots (D), Fv/Fm (E) and ΦPSII (F) of plants were detected after 3 d of larval feeding treatments. In (C) to (F), the data are shown the mean ± SE of six independent experiments. There were five plant samples for each treatment in each independent experiment. (B) Expression of Pitef1 genes in plant roots (n = 3). Control, non-P. indica inoculated and nonlarvae-feeding treatment. LF, rice leaffolder larvae. The different letters indicate statistically significant differences among group samples (P < 0.05).
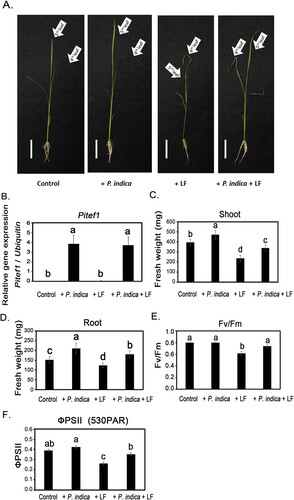
Figure 2. Growth of rice leaffolder fed on P. indica-colonized rice plants. (A) Relative growth rate of larvae fed on P. indica-colonized and noncolonized rice plants. Larvae (3rd instar) were fed plants for 3 d (the larvae grew to 4th instar) and 6 d (larvae grew to 5th instar), and the relative growth rate of larvae was calculated according to the weight of 3rd, 4th and 5th-instar larvae. (B) Percentage of pupation and emergence of larvae. Control, larvae fed on noncolonized plants. The results are shown as the mean ± SE of three independent experiments. Significant differences were analyzed by Student’s t-test. *p < 0.05, ** p < 0.01.
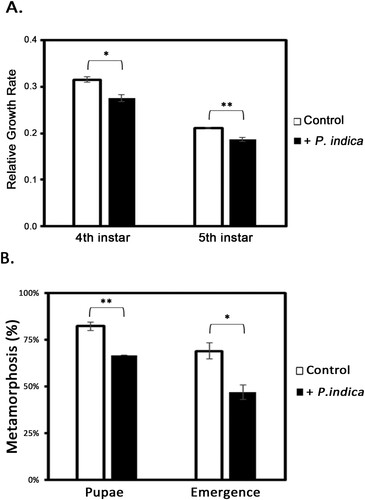
Figure 3. JA and JA-Ile content in leaf tissues of P. indica-inoculated plants under rice leaffolder infestation conditions. The 4-leaf-stage P. indica-inoculated and noninoculated plants were treated with leaffolder larvae, and leaves were collected after 12 h of larval feeding for detection of JA and JA-Ile content. Data are shown as the mean ± SE of three independent experiments. Control, non-P. indica inoculated and nonlarvae-feeding treatment. LF, rice leaffolder larvae. The different letters indicate statistically significant differences among group samples (P < 0.05).
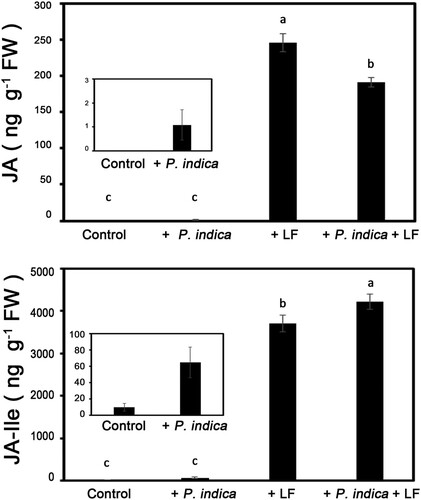
Figure 4. JA biosynthesis gene expressions and larval growth rate in aspirin-treated plants. (A) Effects of aspirin on OsAOS1 gene expression in leaves of P. indica-inoculated and larvae treated plants. (B) Relative growth rate (RGR) of larvae fed on aspirin-treated and P. indica-inoculated plants. The 4-leaf-stage plants were pretreated with aspirin for 12 h before larval feeding. Leaf samples were collected to analyze OsAOS1 expressions after 3 d of larval feeding treatment. Larvae were weighed before being moved to the target plants and after 3 d of feeding, and RGR was calculated based on the changes in weight. Data are the mean ± SE of three independent experiments. The different letters indicate statistically significant differences among group samples (P < 0.05). Control, non-inoculated and nonlarvae-feeding treatment. LF, rice leaffolder larvae.
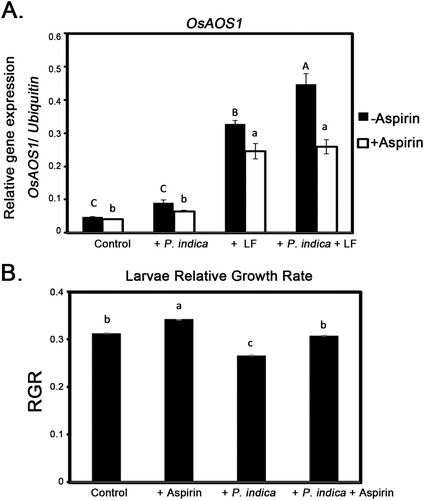
Figure 5. Changes in P. indica- and larvae-induced trypsin inhibitor expression in aspirin-treated plants. The 4-leaf-stage plants were pretreated with aspirin (150 μM) for 12 h before larval feeding. Leaf samples were collected for analysis of trypsin inhibitor activity after 48 h of larvae-feeding treatment. Data are shown as the mean ± SE of three independent experiments. The different letters indicate statistically significant differences among group samples (P < 0.05). Control, non-P. indica inoculated and nonlarvae-feeding treatment. LF, rice leaffolder larvae.
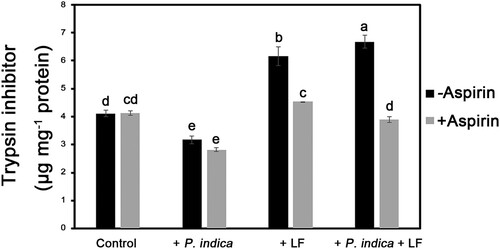
Figure 6. Changes in MDA levels in P. indica-colonized and leaffoler-infested plants. MDA levels in leaves of 4-leaf-stage plants with or without P. indica colonization were determined after rice leaffolder larvae-feeding treatment for 2, 24 and 48 h. Data are the mean ± SE of three independent experiments. The different letters indicate statistically significant differences among group samples (P < 0.05). Control, non-P. indica colonized and nonlarvae-feeding treatment, MDA, malondialdehyde.
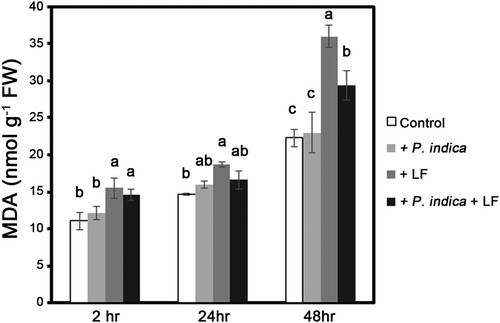
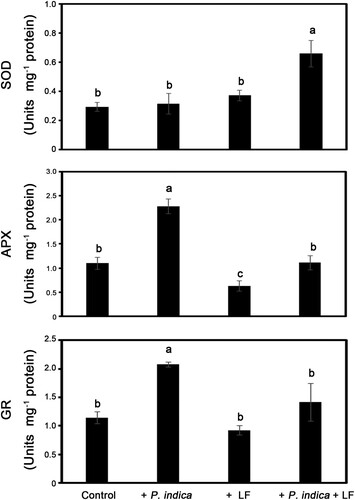
Figure 7. Activities of antioxidant enzymes in P. indica-colonized and leaffolder-infested plants. Superoxide dismutase (SOD), ascorbate peroxidase (APX) and glutathione reductase (GR) activity in leaf samples of the 4-leaf-stage plants with or without P. indica colonization were determined after rice leaffolder larvae-feeding treatment for 48 h. Data are the mean ± SE of three independent experiments. The different letters indicate statistically significant differences among group samples (P < 0.05). Control, non-P. indica colonized and nonlarvae-feeding treatments.