
Figures & data
Figure 1. PCA (principal component analysis) plot was created to assess similarity clustering of sample data using R programming.
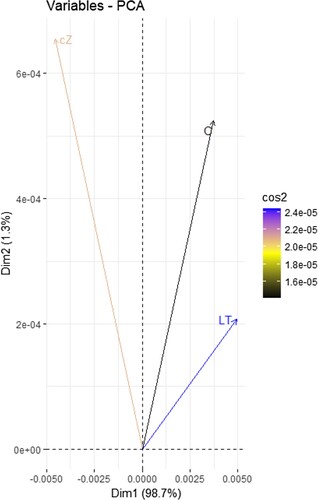
Figure 2. Graphical abstract as A showing the physiological mechanism adopted by maize seedlings when cZ was applied exogenously. The exogenous treatment reduced the endogenous IAA level while enhancing the endogenous GA4 level which in turn accumulated secondary metabolites to improve the photosynthetic rate while compromising root growth and as B showing the physiological mechanism adopted by maize seedlings when cytokinin was inhibited. The inhibition treatment enhanced the endogenous IAA level while reducing the endogenous GA4 level which in turn accumulated secondary metabolites to improve the root growth while compromising photosynthetic rate.
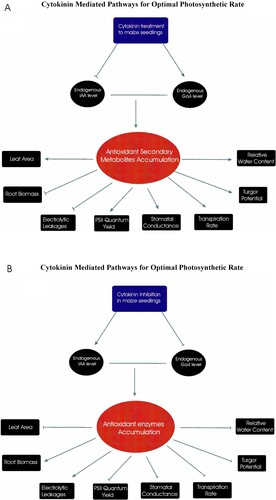
Figure 3. Determination of endogenous cZ (cis-zeatin), GA4 (Gibberellic acid), IAA (Indole-3-acetic acid) in the plants of Z. mays after been exposed to cZ (5 µM) or and its inhibitor – lovastatin – LT (5 µM). Data are mean from 3 independent experiments with standard error bars. Bars labeled with different letters are significantly different (Duncan test; p < 0.05). Experiment was performed at least times in triplicates for validation.
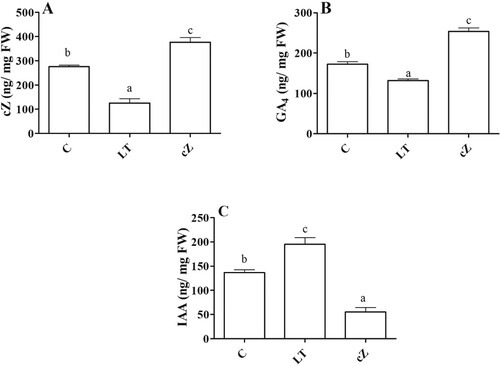
Figure 4. Determination of gene expression analysis of IAA biosynthetic gene (Zm00001d037674) and GA biosynthetic gene (Zm00001d007894) in Zea mays after been exposed to cZ (5 µM) or and its inhibitor – lovastatin – LT (5 µM). Data are mean from 3 independent experiments with standard error bars. Bars labeled with different letters are significantly different (Duncan test; p < 0.05). Experiment was performed at least times in triplicates for validation.
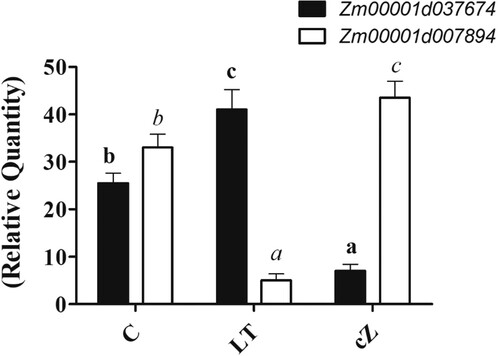
Figure 5. Determination of relative growth rate (A), Net assimilation rate (B), Leaf area ratio (C) and Root shoot ratio (D) in the plants of Z. mays after been exposed to cZ (5 µM) or and its inhibitor – lovastatin – LT (5 µM). Data are mean from 3 independent experiments with standard error bars. Bars labeled with different letters are significantly different (Duncan test; p < 0.05). Experiment was performed at least times in triplicates for validation.
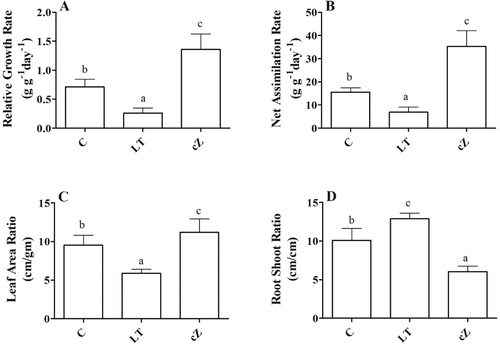
Figure 6. Determination of root and shoot length (A) and Root and shoot weight (B) in the plants of Z. mays after been exposed to cZ (5 µM) or and its inhibitor – lovastatin – LT (5 µM). Data are mean from 3 independent experiments with standard error bars. Bars labeled with different letters are significantly different (Duncan test; p < 0.05). Experiment was performed at least times in triplicates for validation.
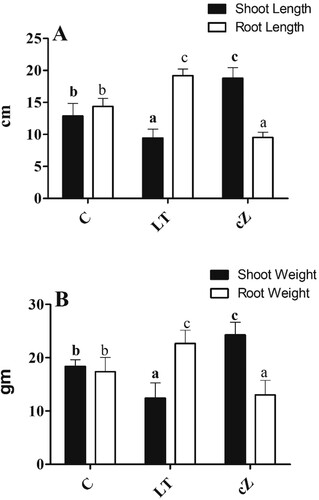
Figure 7. Determination of peroxidase (POD) (A), Super oxidase (SOD) (B), Catalase (CAT) (C) and Ascorbate peroxidase (APX) (D) in the plants of Z. mays after been exposed to cZ (5 µM) or and its inhibitor – lovastatin – LT (5 µM). Data are mean from 3 independent experiments with standard error bars. Bars labeled with different letters are significantly different (Duncan test; p < 0.05). Experiment was performed at least times in triplicates for validation.
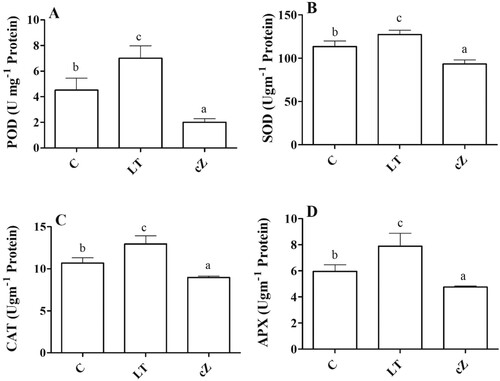
Figure 8. Determination of TPC (total phenolic content) (A), TFC (total flavonoid content) (B), Proline (C) and TPS (total soluble protein) (D) in the plants of Z. mays after been exposed to cZ (5 µM) or and its inhibitor – lovastatin – LT (5 µM). Data are mean from 3 independent experiments with standard error bars. Bars labeled with different letters are significantly different (Duncan test; p < 0.05). Experiment was performed at least times in triplicates for validation.
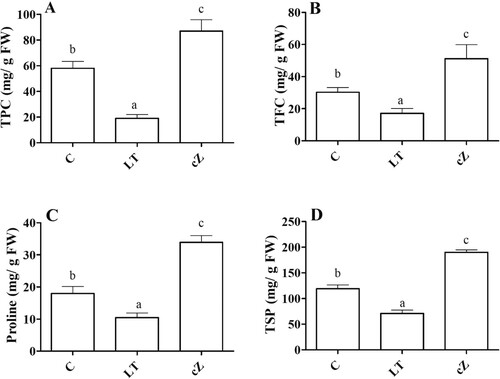
Figure 9. Determination of water potential (A), Osmotic potential (B), Turgor Potential (C), and Relative water content (D) in the plants of Z. mays after been exposed to cZ (5 µM) or and its inhibitor – lovastatin – LT (5 µM). Data are mean from 3 independent experiments with standard error bars. Bars labeled with different letters are significantly different (Duncan test; p < 0.05). Experiment was performed at least times in triplicates for validation.
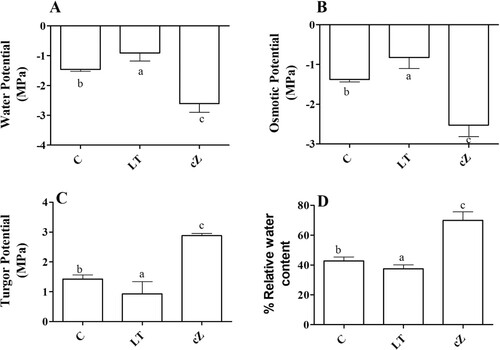
Figure 10. Determination of electrolytic leakage (EL) in the plants of Z. mays after been exposed to cZ (5 µM) or and its inhibitor – lovastatin – LT (5 µM). Data are mean from 3 independent experiments with standard error bars. Bars labeled with different letters are significantly different (Duncan test; p < 0.05). Experiment was performed at least times in triplicates for validation.
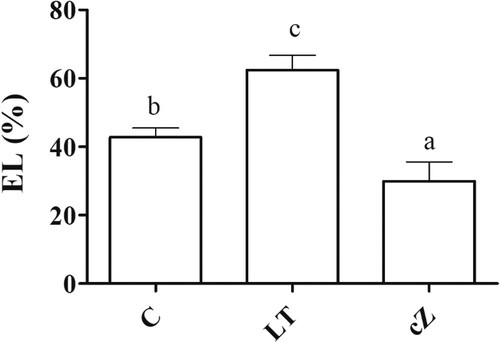
Figure 11. Determination of damage marker such as H2O2(A), MDA (Malondialdehyde, lipid peroxidation marker) (B) and ROS (reactive oxygen species) (C) and DDPH and ABTS inhibitory activities (D) in the plants of Z. mays after been exposed to cZ (5 µM) or and its inhibitor – lovastatin – LT (5 µM). Data are mean from 3 independent experiments with standard error bars. Bars labeled with different letters are significantly different (Duncan’s test; p < 0.05). Experiment was performed at least times in triplicates for validation.
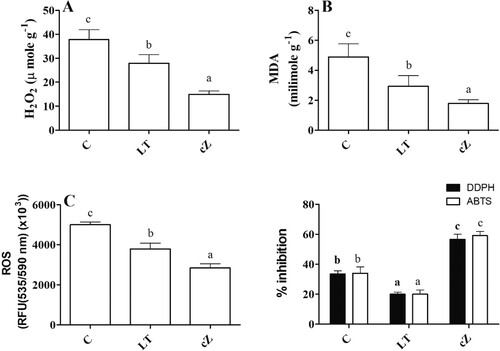
Figure 12. Determination of net photosynthetic rate (A), Stomatal conductance (B), Transpiration rate (C), Intercellular CO2 concentration (D), Water use efficiency (E), Chlorophyll content (F) and PSII quantum yield (G) and Epicuticular wax (H) in the plants of Z. mays after been exposed to cZ (5 5 µM) or and its inhibitor – lovastatin – LT (5 5 µM). Data are mean from 3 independent experiments with standard error bars. Bars labeled with different letters are significantly different (Duncan test; p < 0.05). Experiment was performed at least times in triplicates for validation.
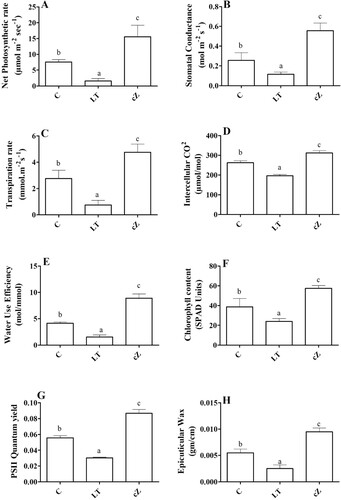
Figure 13. Genes expression analyses involved in the regulation of photosynthetic rate (A) such as FBA, PGK, GAPCP-1, RAF2, CAB, PsbA, CRM3, PsbB, LAR, PETE1, SnRK1 and VIPP1 and genes expression analyses involved in the production of secondary metabolites (B) such as C4H, 4CL, CAD, CCR1, F3H, UGT72E, HCT, F5H, REF1, CH1, FLS, DFR, C4H, and 4CL3 in the treatment of GA, cZ and IAA. Data are mean from 3 independent experiments and expressed in heat map where red shows high expression and blue shows low expression of the genes.
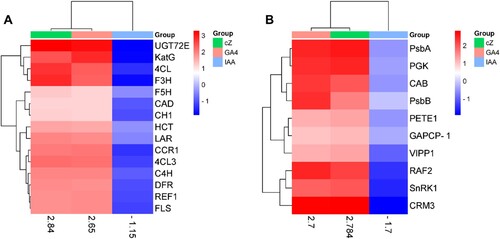
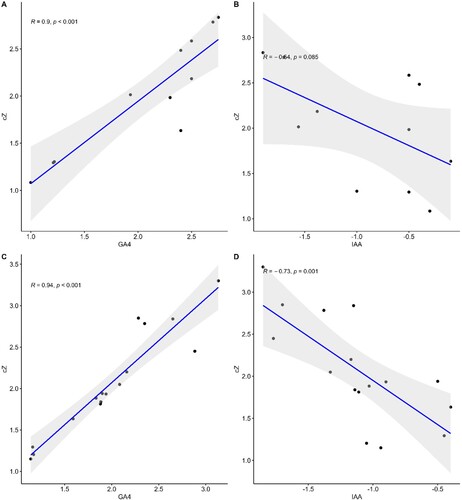
Figure 14. Regression plots representing the expression of genes analyses involved in the regulation of photosynthetic rate such as FBA, PGK, GAPCP-1, RAF2, LAR, CAB, PsbA, CRM3, PsbB, PETE1, SnRK1 and VIPP1 (A) & (C) and in the production of secondary metabolites such as C4H, 4CL, CAD, CCR1, F3H, UGT72E, HCT, F5H, REF1, CH1, FLS, DFR, C4H and 4CL3 (B) & (D) in the treatment of cZ versus GA4 (A & B) and cZ versus IAA (B & C). Data are mean from 3 independent experiments and expressed in R and P values to show the co-relation among genes expression under treatment.
Supplemental Material
Download MS Word (20 KB)Data availability statement
The data that support the findings of this study are available on request from the corresponding author (Anwar Hussain).