Figures & data
Table 1. Characterization of AgNPs in suspension.
Figure 1. Viability of Caco-2 and MCF-7 cells exposed to AgNPs for 24 h, given as a percentage versus the negative control (mean ± SD; n = 3). Significant difference (p ≤ 0.05) versus aall NPs in Caco-2 cells at the same exposure concentration and bversus Ag-20 and Ag-30 at 5 μg/ml in MCF-7 cells.
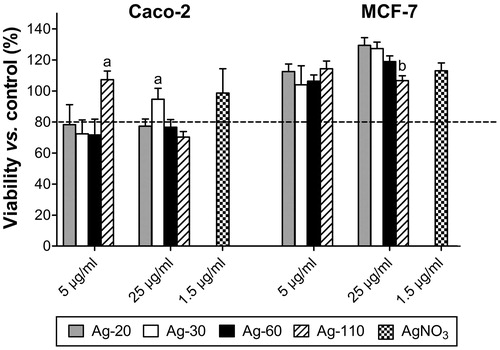
Figure 2. Ag uptake in Caco-2 and MCF-7 cells after 6 and 24 h exposure, as determined by ICP-MS given (A) in μg/ml (mean ± SEM; n = 6), (B) as the number of NPs/ml (mean ± SEM; n = 6) and (C) as a percentage of the total exposure dose (mean ± SEM; n = 6), influence of size (same cell type and exposure time) significant difference (p ≤ 0.05) versus aAg-20, a*Ag-20/Ag-60, a**Ag-20/AgNO3, a***all other groups. Influence of time (same treatment group and cell type), significant difference (p ≤ 0.05) versus b6 h. Influence of cell type (same treatment group and exposure time), significant difference (p ≤ 0.05) versus cMCF-7 cells.
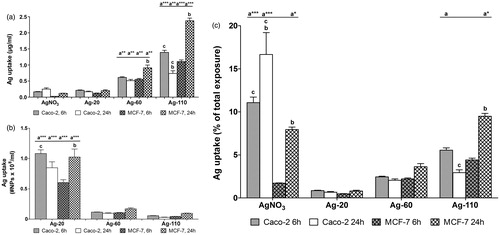
Figure 3. Uptake of AgNPs in Caco-2 and MCF-7 cells after 6 h exposure. Confocal microscopy images of Caco-2 (A) control cells or exposed to (B) AgNO3, (C) Ag-20, (D) Ag-60, (E) Ag-110 for 6 h, and of MCF-7, (F) control cells or exposed to (G) AgNO3, (H) Ag-20, (I) Ag-60 and (J) Ag-110 for 6 h. DAPI/nucleus (blue), LAMP-1 antibody/lysosomes (red) and backscattered signal/AgNPs (green). TEM images of Caco-2 cells exposed for 6 h to (K) Ag-60 and (L) Ag-110 and of MCF-7 cells exposed for 6 h to (M) Ag-60 and to (N, O) Ag-110. Arrows indicate magnifications of the specified area. AgNPs were mostly seen in lysosomal structures (K, L, N), but also in the cytoplasm (O), and very rarely in the nucleus (M). The size and electro density of the AgNPs shows degradation, which appeared to be more severe in the lysosomes when comparing (N) versus (O).
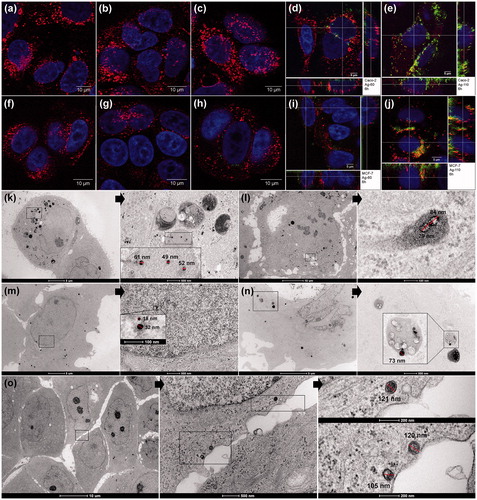
Figure 4. DEGs in Caco-2 and MCF-7 cells after exposure to AgNPs or AgNO3 compared with the control at t = 6 and t = 24 h (n = 3). Genes with a minimal 1.5FC, a p value ≤ 0.05, and an FDR ≤ 0.25 were selected.
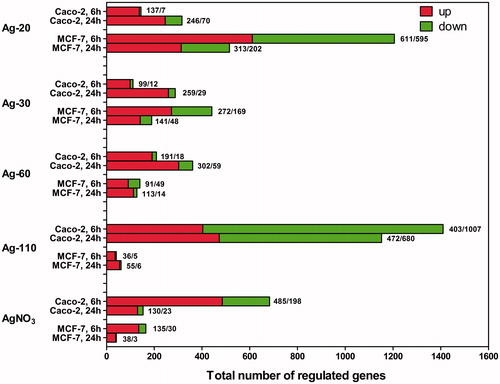
Figure 5. Venn diagrams of up- and downregulated genes (1.5FC) in Caco-2 cells after (A) 6 h and (B) 24 h exposure and in MCF-7 cells after (C) 6 h and (D) 24 h exposure to AgNPs or AgNO3. Genes that were shared in aall groups and bthat were shared only between all NP exposure groups. The tables in each corner show the agenes that were grouped in either group or bgiven as a percentage of the total number of DEGs of each exposure group.
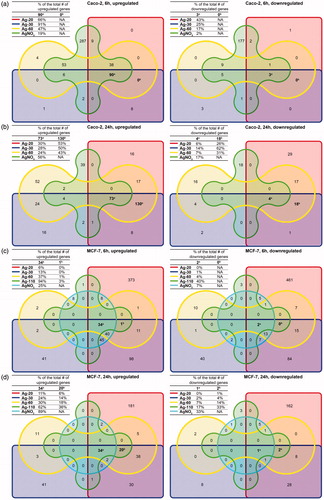
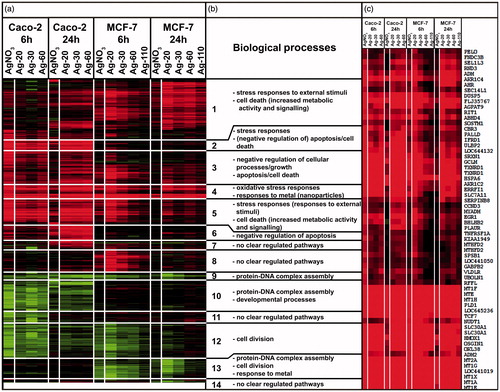
Figure 6. Heatmap of hierarchically clustered DEGs (dendrogram not shown). (A) Each group is given as an average of triplicates with a 2FC threshold. Each row represents a probe for a specific gene and the color and intensity of the color indicates the up- (i.e. red) or downregulation (i.e. green) of this gene. (B) Biological pathways connected to the 14 clusters. (C) Magnification of cluster 4.