
Figures & data
Table 1. Demographic characteristics of the study population. In between brackets characteristics of the subset of individuals that also participated in phase 2.
Table 2. Difference in immunological marker concentration (ng/mL) between workers exposed to multi-walled carbon nanotubes and controls in phase 1Table Footnotea.
Figure 1. Boxplots showing the distribution of Ln-transformed concentrations of CCL20, sIL-1RII, and FGF-BASIC during phase 1 and phase 2, by exposure category. Kruskal–Wallis rank sum test p values for phase 1 were .6172, .02232, .1527, for CCL20, sIL-1RII, and FGF-BASIC, respectively. Wilcoxon rank sum test p values (operators versus controls) for phase 1 were .4352, .01087, and .1188. Kruskal–Wallis rank sum test p-values for phase 2 were .018, .2097, and .1018, for CCL20, sIL-1RII, and FGF-BASIC, respectively. Wilcoxon rank sum test p values (operators versus controls) for phase 2 were .0047, .1375, and .0734.
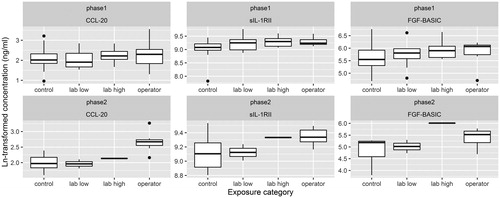
Table 3. Difference in complete blood cell counts between workers exposed to multi-walled carbon nanotubes and controls in phase 1Table Footnotea.
Table 4 Difference in fractional exhaled nitric oxide (ppb) between workers exposed to multi walled carbon nanotubes and controls in phase 1Table Footnotea,Table Footnoteb.
Table 5. Difference in lung function between workers exposed to multi-walled carbon nanotubes and controls in phase 1Table Footnotea.
Figure 2. Boxplots showing the distribution of Ln-transformed concentrations of CC-16, SP-A, and SPD during phase 1 and phase 2, by exposure category. Kruskal–Wallis rank sum test p values for phase 1 were .1388, .4333, .706, for CC-16, SP-A, and SPD, respectively. Wilcoxon rank sum test p values (operators versus controls) for phase 1 were .4, .8576, and .4529. Kruskal–Wallis rank sum test p values for phase 2 were .5381, .2996, .7483, for CC-16, SP-A, and SPD, respectively. Wilcoxon rank sum test p values (operators versus controls) for phase 2 were .5338, .2343, and .6282.
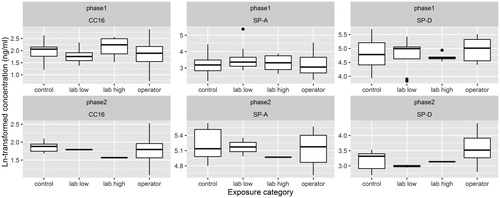
Table 6. Difference in pneumoproteins (ng/mL) between workers exposed to multi-walled carbon nanotubes and controls in phase 1Table Footnotea.