Figures & data
Figure 1. Characterization of Au NPs. TEM, UV-VIS spectra and size distribution of the different types of Au NPs. (A) Au10CIT, (B) Au40CIT, (C) Au40LIP, (D) Au40BPEI, (E) Au40PEG, and (F) Au80LIP. In the upper right corners are shown the chemical formulas of citrate (A and B), lipoic acid (C and F), BPEI (D), and PEG (E).
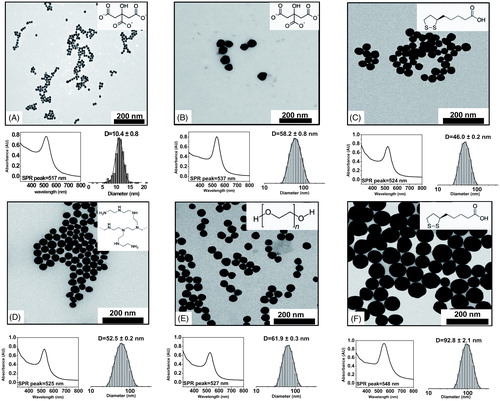
Table 1. Characteristics of Au NPs.
Figure 2. UV-VIS surface plasmon resonance spectrum red-shift of Au NPs after exposure to different concentrations of LPS. Au10CIT were incubated with different concentrations of E. coli LPS. Au NPs were characterized by UV-VIS at 2 min intervals for 2 h. The red point at time zero represents the value of untreated NPs.
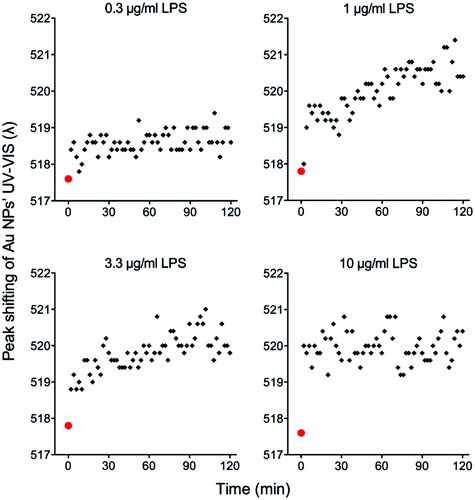
Figure 3. Characterization of Au10CIT after exposure to LPS. Left: UV-VIS spectrum characteristics after NP incubation with 1 μg/ml LPS; center: DLS; right: Zeta-potential. *p < 0.05, **p < 0.01 (treated vs. control); #p < 0.05, ##p < 0.01 (2 h vs. 1 week incubation).
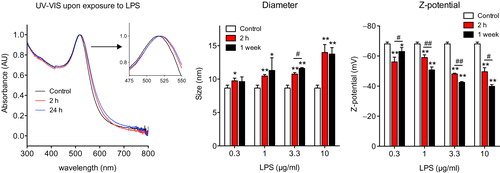
Figure 4. Characterization of Au40CIT after exposure to LPS. Size distribution of the intensity obtained from DLS measurements of Au NPs (left) and LPS-coated Au NPs (center) resulting in a calculated size difference of 13.3 nm. The presence of LPS on the NP surface is evident by analysis of the hyperspectral images obtained by dark-field microscopy (right). HSI intensity = hyperspectral imaging intensity in dark-field microscopy.
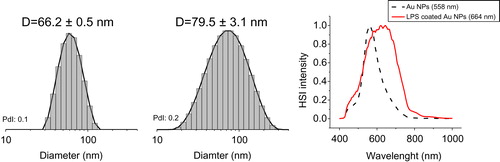
Figure 5. Computational simulation and mathematical relationship between LPS and Au NPs. Upper panel: Agent-based model (ABM) simulation between LPS and Au10CIT in silico. Lower panel: A mathematical relationship between the measured UV-VIS surface plasmon resonance (SPR) peak red-shift (red dots) and simulated amount of LPS bound on the surface of Au NPs was estimated using the Curve Fitting ToolBox in MatLab. On the Y axis is reported the relative peak shift (defined as SPR peak red-shift/maximum SPR peak red-shift). The maximum SPR red-shift was 520 nm in our experiments. The X axis is the amount of LPS bound onto Au NPs that was acquired in silico. The estimated curve follows a Langmuir absorption isotherm.
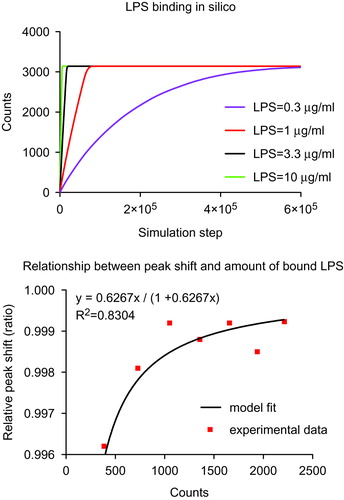
Figure 6. NP surface coating affects LPS-binding. Forty nm Au NPs with different surface coatings (LIP, BPEI and PEG) were incubated with 10 μg/ml LPS for different times. Upper panel: time-dependent size variations measured by dynamic light scattering (DLS). Lower panels: size distribution variations of Au NPs before and after incubation with LPS. *p < 0.01 (treated vs. control).
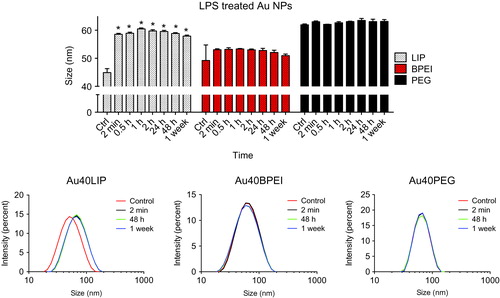
Figure 7. LPS binding to the NP surface interferes with the formation of a stable biomolecular corona. LPS-coated and uncoated Au40LIP were incubated with 100% human plasma at 37 °C for 4 h and washed with PBS to remove the loose biomolecular corona. Upper left: size variation, ***p < 0.001; upper right: size distribution. LPS-coated and uncoated Au40LIP were incubated with 10%, 55%, and 100% human plasma at 37 °C for 4 h and washed with PBS. Human plasma proteins adsorbed on the NP surface were analyzed by SDS-PAGE. Lower left: SDS-PAGE gel; lower right: total band intensity of proteins recovered from LPS-coated and uncoated Au40LIP incubated with 100% human plasma. The results are the mean ± SD of data obtained from two different samples. *p < 0.05.
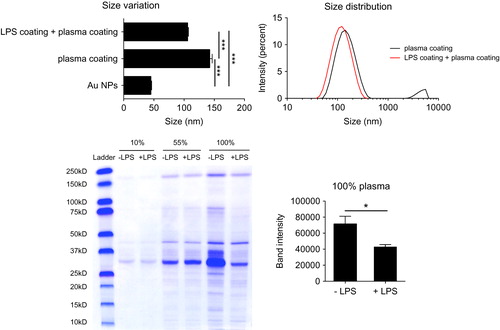
Figure 8. LPS-coated Au NPs induce inflammatory activation of human monocytes. Au10CIT were incubated with 200 ng/ml of LPS for 1 h. Unbound LPS was washed off, and the effects of LPS-coated Au NPs were assessed on human primary monocytes after 18 h incubation, in comparison with those triggered by 1 ng/ml LPS. Upper panels: expression of IL1B and IL1RN genes. Lower panels: production of the IL-1β and IL-1Ra cytokines. The results are the mean ± SD of data obtained from one experiment representative of 3 performed. *p < 0.05, **p < 0.01 (LPS-coated vs. uncoated NPs).
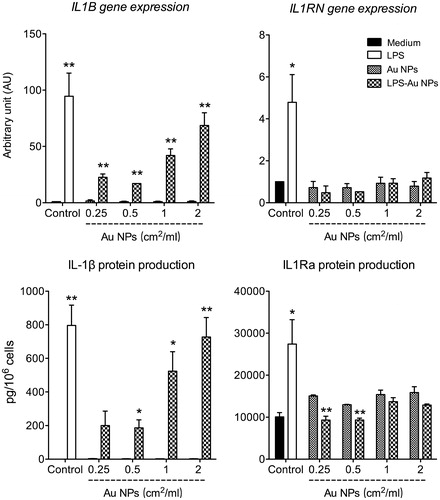
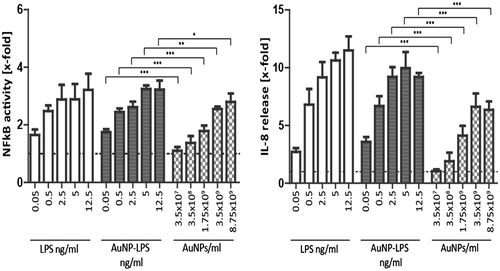
Figure 9. Activation of reporter HEK293 cells with free vs. NP-bound LPS. HEK293 cells transiently overexpressing TLR4, CD14, and MD2 were transfected with an NFκB-responsive LUC reporter gene. Left panel: NFκB activity was measured in response to free LPS, to LPS-coated Au40CIT NPs (the amount of LPS used for coating is indicated), and to the corresponding number of NPs. NFκB activity was assessed by measuring LUC-dependent light emission. Right panel: Release of IL-8 in response to the same stimuli was detected by ELISA in the culture supernatants. Results are expressed as fold increase vs. the value in untreated cell cultures (= 1; indicated as dotted horizontal line), and presented as mean ± SD of 3 independent experiments. Values were compared to the respective concentration, *p < 0.05, **p < 0.001, ***p < 0.0001.