Figures & data
Figure 1. TEM image of NM400 CNTs in exposure medium showing curved, often intertwined, carbon nanotubes.
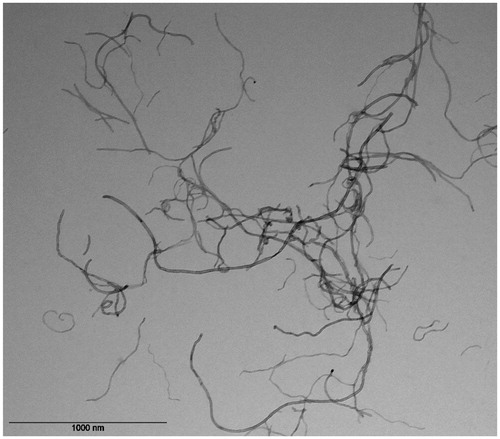
Figure 2. CNT exposure does not affect cell viability. Cells were exposed to 1.92 µg/cm2 (High dose) or 0.92 µg/cm2 (Low dose) of NM400 for 13-weeks. Viability was determined every week using trypan blue assay before sub-culturing cells for new round of exposure. At both concentrations, cell viability of exposed cells remained similar to that of control cells throughout the whole exposure duration. Data represent mean values of biological duplicates for each week.
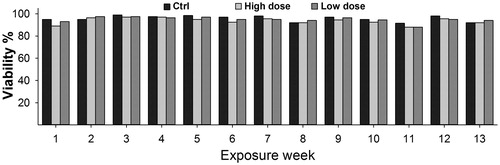
Figure 3. CNT exposure increases ROS production. Cells were exposed to NM400 for 72 h, and ROS generation was measured using the DCF-DA assay. (A) Representative LSM image of exposed and control cells. (B) Bar graph showing relative fluorescence per µg protein from two independent experiments each performed with three replicates. Error bars = standard error of mean (SEM); *statistically significant difference relative to control (p < 0.05, paired t-test). High dose:1.92 µg/cm2 and low dose: 0.96 µg/cm2.
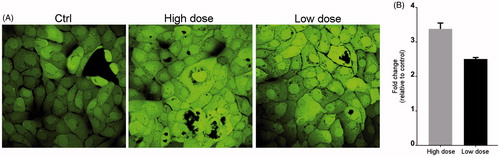
Figure 4. Comet assay shows no DNA damage after CNT exposure. Oxidative DNA damage after treatment of cells with 1.92 µg/cm2 (high dose) and 0.96 µg/cm2 (low dose) was evaluated using a modified comet assay. No major changes in DNA damage was observed at any time point. Graphs show average of three independent experiments all performed in triplicates (error bars = SEM).
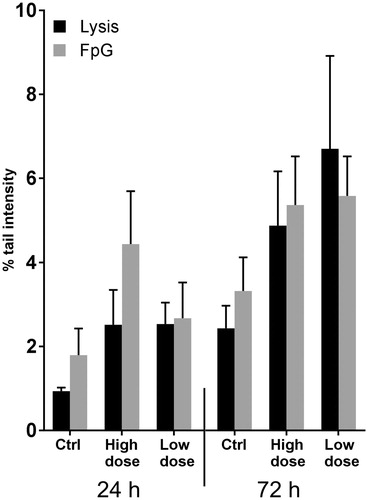
Figure 5. CNT exposure changes expression of apoptotic proteins. HBEC-3KT cells were exposed to NM400 for 13 weeks, lysed, and 300 µg protein from each condition was used for apoptosis protein array. Because of the nature of experiment, the array was possible to run only once with independent biological replicates for each exposure. (A) representative protein arrays; (B) densitometric analysis of the array spots. Only proteins that changed more than 1.5 fold compared with control are shown. High dose: 1.92 µg/cm2 and low dose: 0.96 µg/cm2.
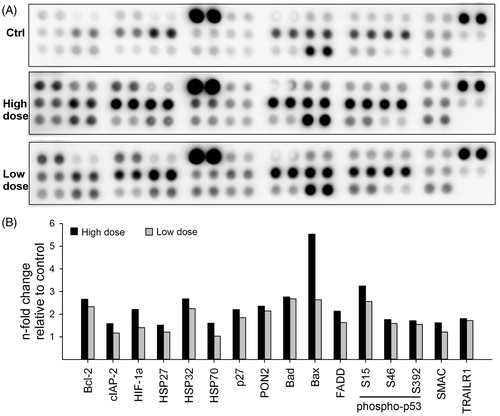
Figure 6. Volcano plots of all detected and quantified proteins. Plots illustrate the overall pattern of protein expression and their relative abundances in high dose versus Ctrl (A), low dose versus Ctrl (B) or high dose versus low dose (C). The horizontal dotted line in each plot represents p < 0.05. The red dots mark the significantly altered proteins.
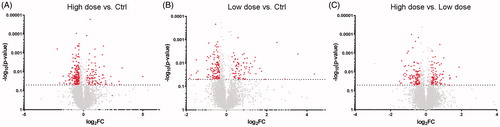
Figure 7. Differentially expressed proteins in CNT-exposed cells. After exposure for 13 weeks to high dose (1.92 µg/cm2) and low dose (0.96 µg/cm2), proteins were extracted from cells and subjected to LC-MS/MS analysis. From >5000 identified proteins, only proteins showing more than 1.2 × fold change compared with control and with p < 0.05 were considered. The actual numbers shown on the top of bars indicate total upregulated or downregulated proteins for each comparison.
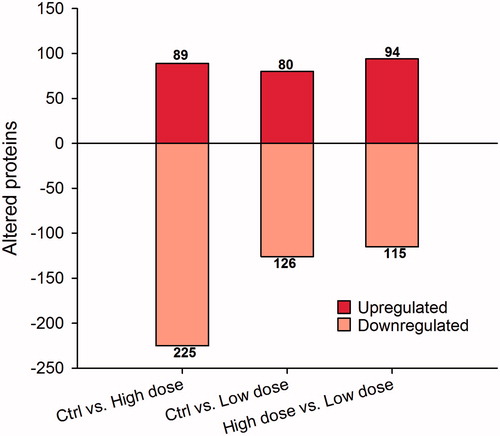
Figure 8. Heat-map showing differentially regulated proteins in two exposure conditions high dose and low dose compared with control. First, the different CNT exposure conditions were compared with control. Thereafter, the common proteins were identified from the list of differentially regulated proteins. Figure shows fold change in log2 scale and the protein IDs. Green color indicates proteins that are downregulated in high dose and low dose compared with control, while red color represents upregulated proteins in high dose and low dose compared with control.
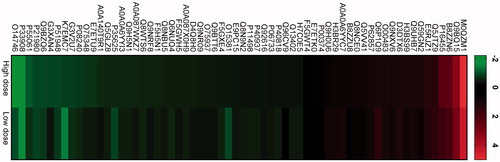
Figure 9. The most affected biological pathways as inferred from the IPA analysis. After comparison of exposed conditions to control, the protein groups with Student’s t-test p values <0.05 and mean absolute log2 LFQ ratio >0.58 were analyzed through the use of QIAGEN’s Ingenuity® Pathway Analysis to determine enriched functional categories. The figure lists biological pathways that are predicted to be regulated by significantly altered proteins from the exposure conditions: high dose and low dose.
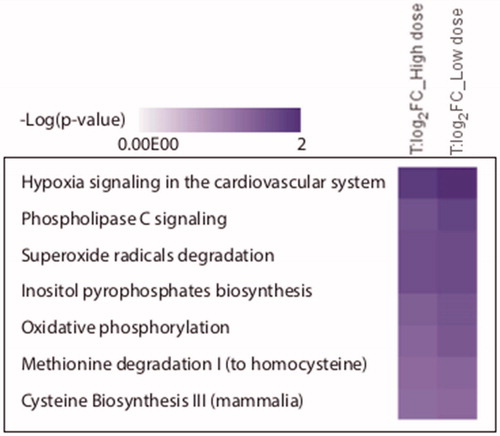
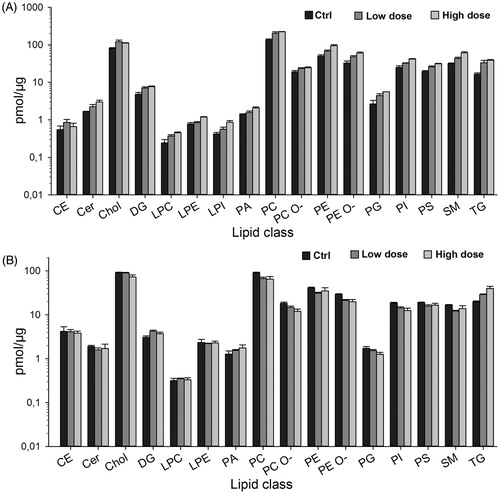
Figure 10. Lipid classes in exposed versus control cells. Lipids were extracted from the CNT-exposed cells as described in materials and methods, and subjected to shotgun lipidomics. Amount of different lipid classes in cells at the end of 13 weeks of exposure (A) and 2 weeks post-exposure (B) are shown as pmol/µg protein (note the logarithmic scale).