
Figures & data
Figure 1. Characterization of TMAT-AuNPs with varying core sizes. (A) Gel electrophoresis with relative core sizes diagram. Arrow illustrates particle movement in the electric field, where the smaller particles move faster. (B) N,N,N-trimethylammoniumethanethiol (TMAT) Ligand Structure (C) UV-Visible spectra at concentration 50 mg/L: 0.8 nm (purple); 0.9 nm (brown); 1.3 nm (blue); 1.7 nm (red); 5.8 nm (green).
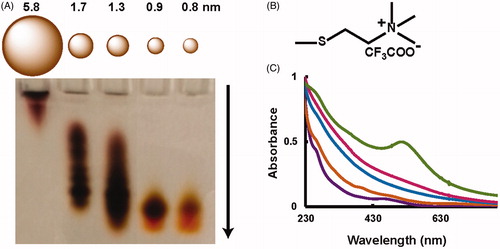
Figure 2. Developmental toxicity of varying core sizes based on mass concentration. Embryonic zebrafish were exposed to five AuNPs at varying mass per volume concentrations in the wells (the major x-axis is the log10 of the concentration in μg/mL); x minor axis shows the actual concentrations). The portion of animals exhibiting any endpoint is plotted on the y-axis. A total of 36 animals were exposed per concentration, with 22 morbidity and mortality endpoints assessed. A logistic regression model was fit to the log of each AuNP data (different color lines). The different colors corresponds to the difference core diameters..
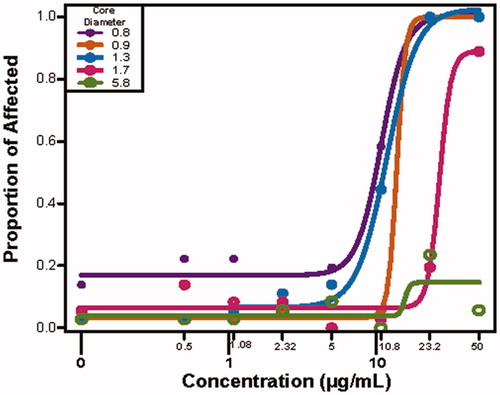
Figure 3. The developmental toxicity profile for the five narrowly spaced TMAT-AuNP when the exposure medium is expressed in surface area (nm2). The proportion of affected animals are plotted for each different core diameter and a curve of best fit is applied. The y-axis is the proportion of affected animals for any endpoint, and the x-axis the log10 transformed surface area of the different diameter AuNPs.
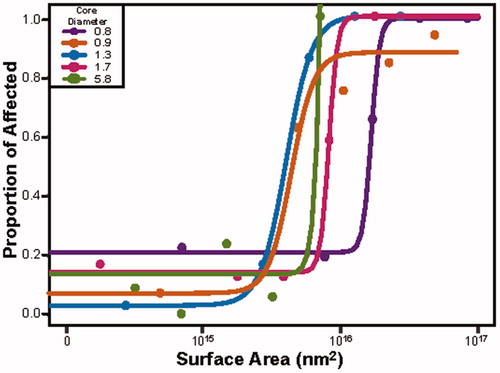
Figure 4. Toxicity evaluated amongst all core sizes based on the number of particles. A model is fit to all the TMAT-AuNP data with the varying color representing different mass concentrations. The size of the dot represents the core size of the particle. An effective concentration that resulted in 50% effect (EC50) is depicted with the dotted line. The 95% confidence interval of the fitted model is illustrated in gray, with the white line representing the predicated logistic model curve. The x-axis is the number of particles per mL, while the y-axis is the proportion of affected individuals when exposed to TMAT-AuNPs.
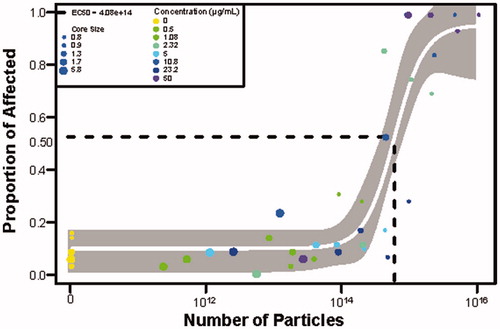
Figure 5. Toxicity profile at a constant number of particles, regardless of core size. Embryos were exposed to a constant number of TMAT-AuNPs (6.71 × 10¹³ per mL) for all five core sizes. These exposure scenarios were achieved by varying masses used per volume. For each core diameter, the proportion of affected individuals for any morphological endpoint is the y-axis. The data represents n = 32 for each TMAT-AuNP.
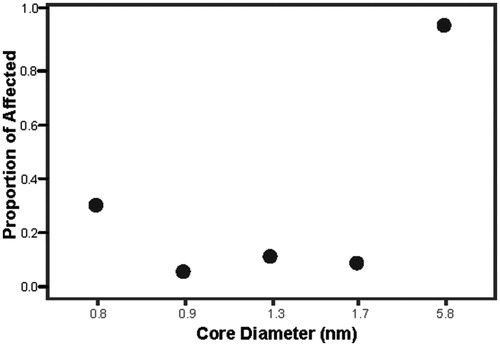
Table 1. Number of particles measured in 24 hpf zebrafish embryos exposed to 3.3 × 10¹³ per mL AuNP for five core diameters.