Figures & data
Table 1. Description of the sonication conditions used.
Table 2. Summary of features of probe and vial sonicator sonication.
Figure 1. TEM images of 0.2 mg/mL MWCNT material stock suspension in tannic acid sonicated in a vial sonicator by the sonication methods: (a) VSc (b) VSd, (c) VSd, (d) variation in the % of fiber length with time (1< fiber length (µm)<5). (e–f) length size distribution after 6 (VSd) and 12 h (VSe) of sonication.
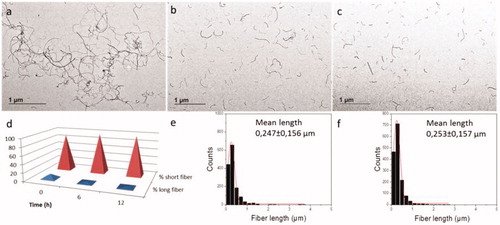
Table 3. Mean fiber length, corresponding standard deviation and % of total individual fibers counted: “short: 0.15 µm Length 0.9 µm” and “long: 1 µm Length 5 µm” of samples subject to probe sonication and vial sonicator sonication (PSa: probe 0.2 mg/mL, PSb: probe 1 mg/mL, and VSc: vial sonicator 0.2 mg/mL), persistent vial sonicator sonication for 6 (VSd) and 12 h (VSe) and subsequent storage for 1 month after sonication (PSa, PSb and VSc).
Figure 2. Temporal variation of UV-Vis absorption at 800 nm of MWCNTs dispersed with Tannic acid (300 mg/L).
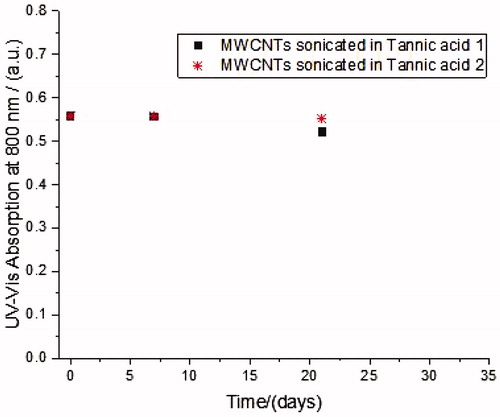
Figure 3. TEM images of MWCNT material stock suspension in tannic acid as prepared (a,c,d) and after 48 h in culture medium (b,d,f) as follows: (a,b) PSb, (c,d) PSa, (e,f) VSc. Corresponding graphs of stocks suspensions show the length measured and the Gaussian distribution with mean length calculated.
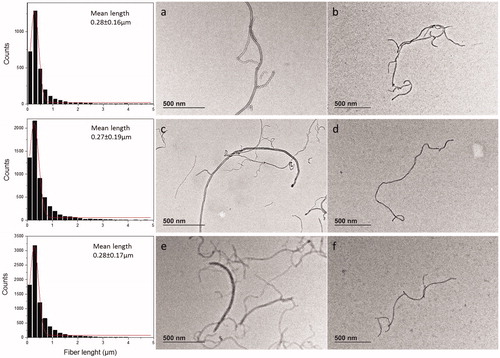
Figure 4. A549 in vitro toxicity experiments using CFE (A,C) and HCI (B,D). Cells exposed to different concentrations of probe and vial sonicated MWCNTs from stock 0.2 mg/mL (PSa and VSc) and the corresponding solvent controls (A,B). Cells exposed to probe-sonicated MWNCTs from stock 1 mg/mL (PSb) and its solvent control (C,D). Cell viability was calculated by counting colonies formed after exposure as compared with the negative control for CFE assay and by determining the number of nuclei in the exposed conditions as compared to the number of nuclei in the negative control for HCl test. Results are expressed in cell viability as percentage of negative control. The tannic acid concentrations corresponding to each MWCNT concentration tested are expressed in µg/mL.
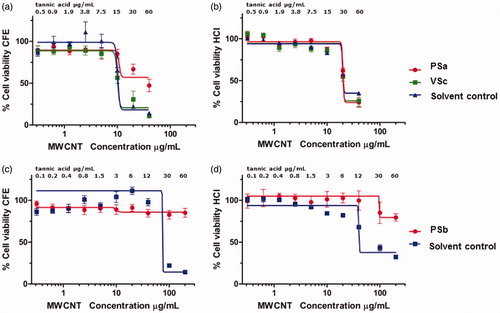
Figure 5. Nuclei-stained A549 cells exposed to MWCNTs for in vitro toxicity experiments using HCI. After incubation for 48 h with the corresponding controls or MWCNTs, cells were fixed, stained with Hoechst and imaged using INCell Analyzer. Negative control (A), solvent control for 0.2 mg/mL (B), solvent control for 1.0 mg/mL (C), PSb stock at 200 µg/mL. (D), PSa stock at 40 µg/mL concentration (E), VSc stock at 40 µg/mL concentration (F).
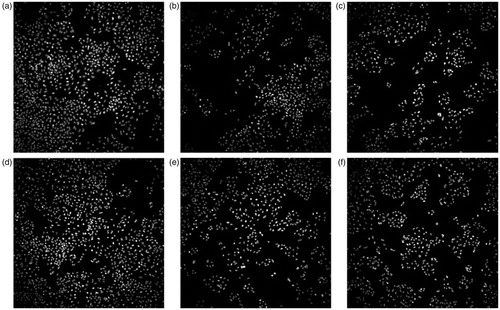
Table 4. IC50 estimated in vitro values for MWCNTs dispersed using a probe and a vial sonicator and corresponding solvent control (tannic acid).
Figure 6. (a) UV-Vis spectra of tannic acid solution (300 mg/L) before and after Amicon 10 KDa filtration, 0.2 µm filtration and filtrate of sonicated MWCNTs (PSb), (b) Cell viability percentage by CFE of A549 exposed to tannic acid after filtration and corresponding to 60 µg/mL of tannic acid.
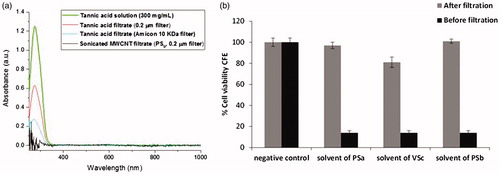
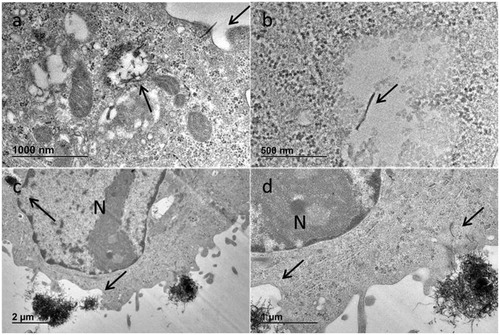
Figure 7. Uptake mechanisms observed after A549 exposure to MWCNTs; this material is clearly internalized by cells mainly by 2 different mechanisms: (i) directly passing through the membrane for single MWCNTs of around 300 nm length, that are later found inside lysosomes or late endosomes (a,b) or (ii) via endocytic pathway after membrane invagination mainly for MWCNT bundles (c) or both mechanisms together (d). (a) PSb; (b) VSc; (c,d) PSa.