Figures & data
Table 1. Summary of NP characteristics; BET-area, primary particle size, size in RPMI/LHC-9 medium, and Ni-release in RPMI/LHC‐9 medium.
Figure 1. Cytotoxicity of Ni and NiO NPs following exposure of HBEC or THP1* cells for 3 or 24 h. Both cell types were exposed to Ni and NiO NPs corresponding to total Ni concentration of 5, 10, 25 and 50 µg/ml (1.6, 3.1, 7.8, and 15.6 μg Ni/cm2) for 3 h and 24 h in HBEC cell culture media. The bars show mean ± SEM.
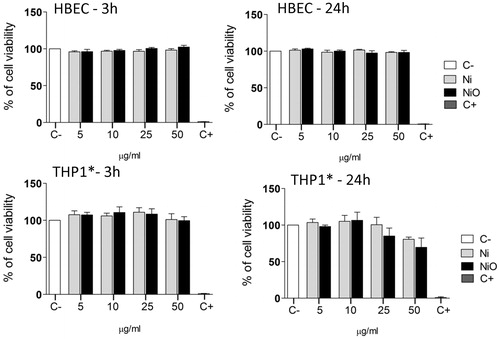
Figure 2. Cytokine release following 3 h or 24 h exposure of THP1* cells to 50 µg/ml (corresponding to total Ni concentration, 15.8 μg Ni/cm2) Ni NPs, NiO NPs or SiO2 (quartz).
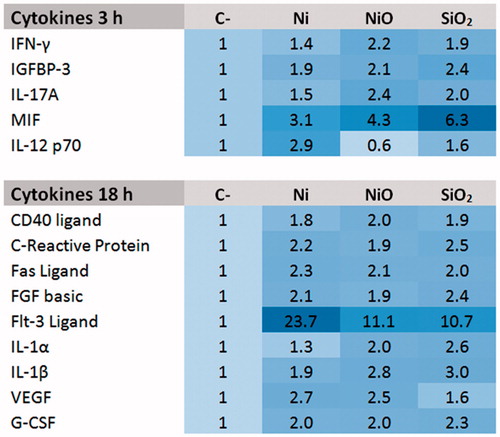
Figure 3. Secretion of VEGF (left) or IL-1β following 18 h exposure of THP1* cells to 50 µg/ml (15.8 μg Ni/cm2) Ni NPs, NiO NPs or SiO2 (quartz). The bars show mean ± SEM and significant differences compared to the control are marked with asterisks (* for p-value < 0.05, ** for p-value < 0.01, *** for p-value < 0.001).
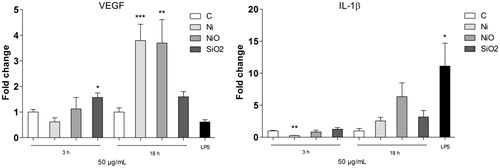
Figure 4. DNA damage caused by conditioned media. (A) Conditioned media was generated by exposing THP1* cells to 50 µg/ml (15.8 μg Ni/cm2) for 3 or 18 h. Next, the media was removed and centrifuged in order to remove remaining particles. HBEC cells were then exposed to the NP-free CM. (B) CM from THP1* cells caused DNA damage in HBEC cells following 3 h exposure. (C) A lower concentration (10 µg/ml) of direct exposure to the particles caused similar extent of damage. The bars show mean ± SEM and significant differences compared to the control are marked with asterisks (* for p-value < 0.05, ** for p-value < 0.01, *** for p-value < 0.001).
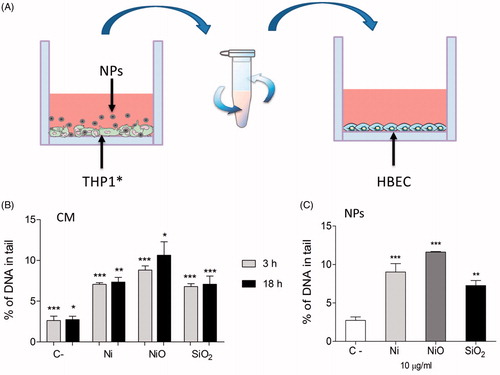
Figure 5. DNA damage observed in a co-culture system. (A) THP1* cells cultured in a transwell were exposed to 50 µg/ml (13.2 Ni/cm2) for 3 or 18 h and DNA damage was analyzed in HBEC cells cultured beneath the transwell. DNA damage was observed in HBEC cells following 3 h exposure (B) and 18 h exposure (C). The bars show mean ± SEM and significant differences compared to the control are marked with asterisks (* for p-value < 0.05, ** for p-value < 0.01, *** for p-value < 0.001).
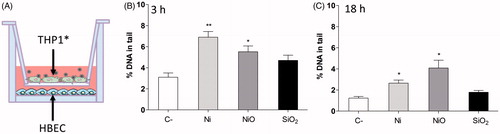
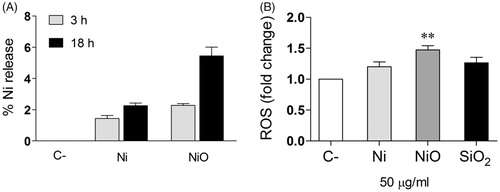
Figure 6. Conditioned media – Ni ion release and ROS formation. (A) The amount of Ni release (% of added) was analyzed in the CM by using ICP-MS. (B) HBEC cells were exposed to the CM and ROS formation (fold change compared to control) was analyzed by the DCFH-DA assay. The bars show mean ± SEM and significant differences compared to the control are marked with asterisks (* for p-value < 0.05, ** for p-value < 0.01, *** for p-value < 0.001).