Figures & data
Table 1. Composition of the artificial digestion fluids of the in vitro digestion model (per 1000 mL) (Versantvoort et al. Citation2005; Walczak et al. Citation2012).
Table 2. Physicochemical characteristics of AgNPs.
Figure 1. Silver content in pristine and in vitro digested (IVD) AgNPs suspensions and AgNO3 solution. (a) Silver content measured as total Ag using ICP-MS. (b) Silver content measured as AgNPs using spICP-MS. Concentrations are given as the mean ± SD (n = 3). *Significant difference between the pristine and IVD suspension of the same AgNPs (p < 0.05).
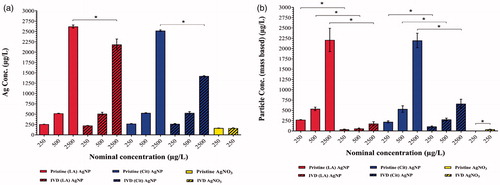
Figure 2. Cell viability of a Caco-2/HT29-MTX co-culture after 24 h exposure to a concentration range of pristine: (a) (LA) and (Cit) AgNPs and (b) AgNO3, and IVD; (c) (LA) and (Cit) AgNPs and (d) AgNO3 using the WST-1 viability assay. Viability is given as a percentage of the control (mean ± SD; n = 3). ×Significant difference between AgNPs at the same concentration (p < 0.05). *,#Significant difference between any concentration and the control within the same treatment (p < 0.05).
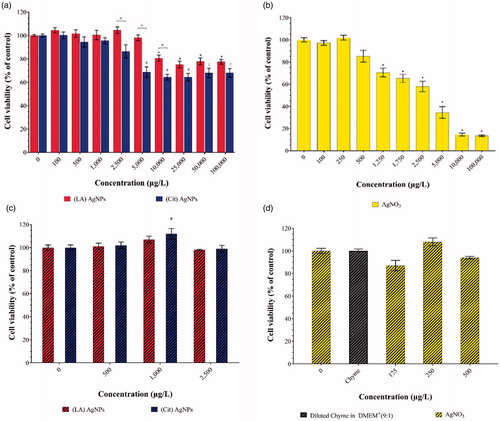
Figure 3. Silver uptake/adhesion of (LA) and (Cit) AgNPs and AgNO3 in differentiated Caco-2/HT29-MTX cells after 24 h exposure, measured and expressed as total Ag after (a) exposure to pristine AgNPs and AgNO3; (c) exposure to in vitro digested AgNPs and AgNO3. Also expressed as AgNPs after (b) exposure to pristine AgNPs and AgNO3; (d) exposure to in vitro digested AgNPs and AgNO3. Concentrations are given as the mean ± SD (n = 3). Values with different letters are significantly different at the same concentration (p < 0.05).
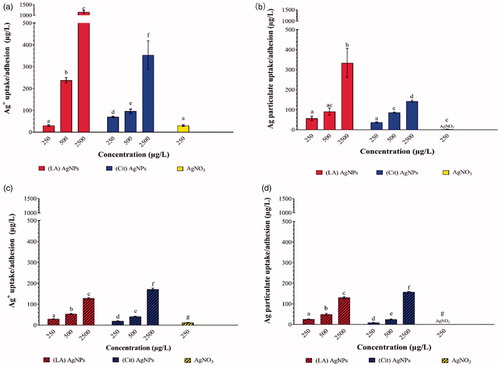
Figure 4. Uptake/adhesion of AgNPs after 24 h exposure. Confocal microscopy images of 21-day-old Caco-2/HT29-MTX cells. (a) without exposure to AgNPs (negative control), after exposure to 2500 μg/L, (b) pristine (LA) AgNPs, (c) pristine (Cit) AgNPs, (d) IVD (LA) AgNPs, and (E) IVD (Cit) AgNPs. Nuclei were stained in red (RedDot-2), actin was stained in green (Alexa-488 Phalloidin) and AgNPs are shown in white (back scatter).
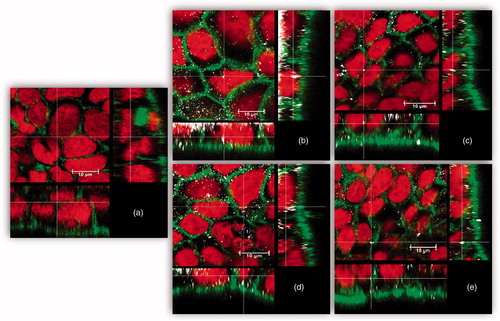
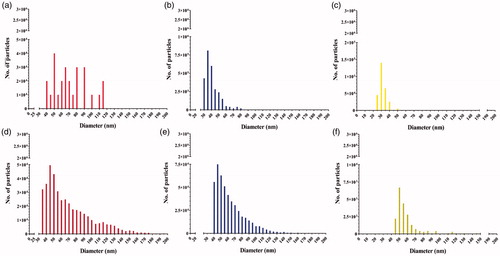
Figure 5. Number-weighted size distributions generated by spICP-MS measurements in exposure suspensions. (a) 500 µg/L pristine (LA) AgNPs, (b) 500 µg/L pristine (Cit) AgNPs, (c) 250 µg/L pristine AgNO3, (d) (LA) 500 µg/L IVD AgNPs, (e) 500 µg/L IVD (Cit) AgNPs, and (f) 250 µg/L IVD AgNO3.
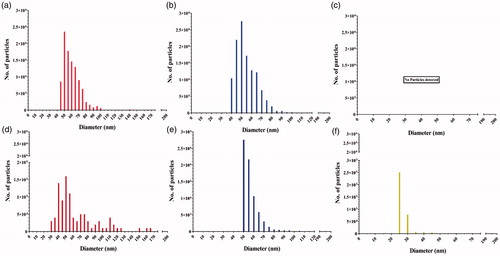
Figure 6. Number-weighted size distributions generated by spICP-MS measurement of Caco-2/HT29-MTX cellular silver content after 24 h exposure to (a) 500 µg/L pristine (LA) AgNPs, (b) 500 µg/L pristine 50 nm (Cit) AgNPs, (c) 250 µg/L pristine AgNO3, (d) 500 µg/L IVD (LA) AgNPs, (e) 500 µg/L IVD (Cit) AgNPs, and (f) 250 µg/L IVD AgNO3.