
Figures & data
Table 1. Characteristics of the investigated NM panel.
Figure 1. Metabolic activity of primary neutrophils and dHL-60 cells following NM exposure. Primary neutrophils (black lines) and dHL-60 cells (grey lines) were exposed to Ag (A), ZnO (B), CuO (C) and TiO2 (D) NMs for 20 h at concentrations ranging between 0.98 μg/mL and 125 μg/mL. Untreated control cells were exposed to cell culture medium only. Cellular metabolic activity was assessed using the alamarBlue assay and expressed as a percentage of the untreated controls (% cell metabolic activity) (n = 3–5). Error bars indicate SEM. Significant differences between dHL-60 cells and primary neutrophils are indicated by *p < 0.05, **p < 0.01, ***p < 0.001 (ANOVA followed by post-hoc Bonferroni test). To further assess the impact of Ag, ZnO, CuO and TiO2 NMs on cell viability, the morphology of cells was investigated. Untreated (UT) and NM-treated cells were fixed, stained and visualized using light microscopy. Representative images are shown of dHL-60 cells (upper panels) and primary neutrophils (lower panels) following a 4 h exposure to NMs (E). Scale bar = 100 µm. IC50 values were calculated and used to rank the toxicity of NMs for both cell types (F).
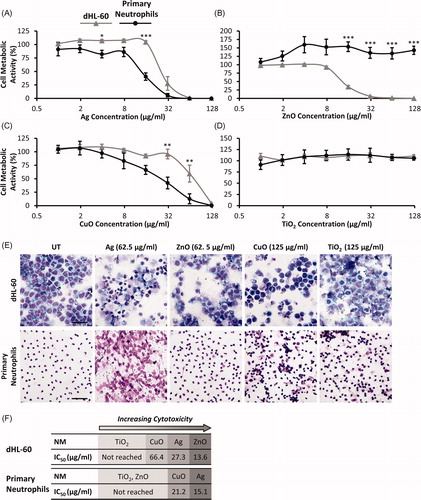
Figure 2. Production of pro-inflammatory cytokines IL-8, MCP-1 and GRO-α, and the anti-inflammatory cytokine IL-1Ra by primary neutrophils and dHL-60 cells 20 h post-exposure to NMs. dHL-60 cells (left panel) and primary neutrophils (right panel) were exposed to Ag, ZnO, CuO or TiO2 NMs for 20 h. Untreated (UT) control cells were exposed to cell culture medium only. Cell supernatants were analyzed for the presence of IL-8 (A), MCP-1 (B), GRO-α (C) and IL-Ra (D) using Bio-Plex human cytokine kits. Data are expressed as mean cytokine levels of production (pg/mL) (n = 3–5). Error bars indicate SEM. Significant differences with untreated controls are indicated by *p < 0.05, **p < 0.01, ***p < 0.001 (ANOVA followed by post-hoc Bonferroni test).
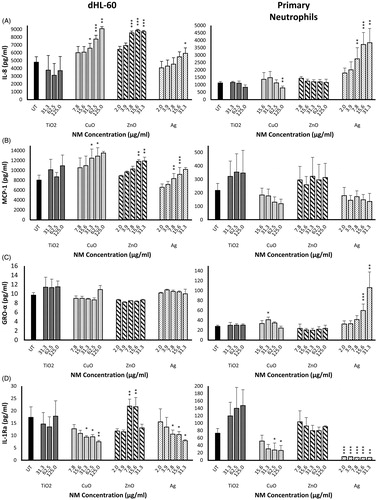
Figure 3. Extracellular superoxide anion production by primary neutrophils and dHL-60 cells 2 h post-exposure to NMs. Primary neutrophils (left panel) and dHL-60 cells (right panel) were exposed to either Ag (A), ZnO (B) or TiO2 (C) NMs at sub-lethal concentrations. O2•− production was measured using the cytochrome C reduction assay. Results are expressed as the average level of O2•− production (nMoles/mL) (n = 3–5). Error bars indicate SEM. Significant differences with untreated (UT) controls are indicated by *p < 0.05, **p < 0.01, ***p < 0.001 (ANOVA followed by post-hoc Bonferroni test).
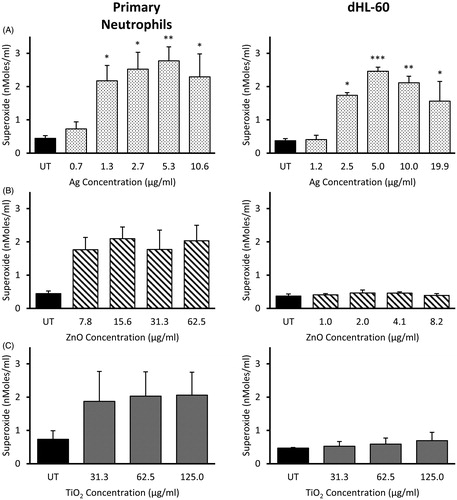
Figure 4. NM-induced release of neutrophil extracellular traps (NETs) in primary neutrophils immunostained for nuclear DAPI (green) and neutrophil elastase (red). Representative images of primary neutrophils following 4 h exposure to increasing concentrations of Ag NMs are presented (A). Fixed and stained cells were imaged using confocal microscopy and qualitatively categorized as either normal (multi-lobed nuclei), apoptotic (condensed nuclei), or NETs which were further sub-categorized as having either ‘diffuse’ or ‘spread’ morphologies. Examples of neutrophil morphologies are shown. Aggregation of NETs resulting in the formation of larger structures is visible when primary neutrophils were exposed to 125 µg/mL Ag NMs, as indicated by white dashed line. Primary neutrophils exposed to 46.5 µg/mL Ag showed increase NET formation over time (B). Concentration and time-dependent NET release in primary neutrophils exposed to Ag NMs was quantified based on neutrophil elastase signal and expressed as a fold-change relative to untreated (UT) controls (n = 3–5) (C). Error bars indicate SEM. Significant differences with untreated controls are indicated by *p < 0.05, **p < 0.01, ***p < 0.001 (ANOVA followed by post-hoc Dunn’s multiple comparison test). NET formation was not observed in cells exposed to ZnO, CuO or TiO2 NMs at any of the tested concentrations (31.25–125 µg/ml) (D). Scale bar = 30 µm.
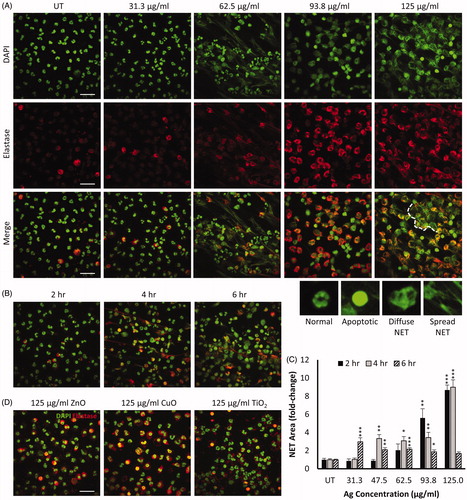
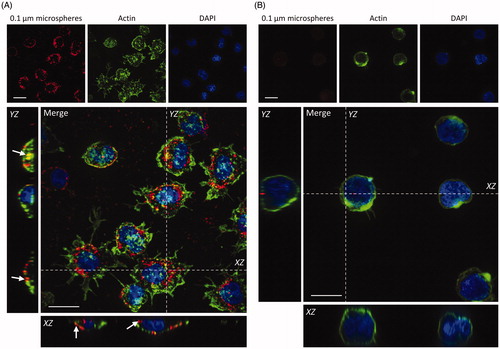
Figure 5. Uptake of 100 nm fluorescently labeled NMs by primary neutrophils and dHL-60 cells. Primary neutrophils (A) and dHL-60 cells (B) were incubated with 100 nm fluorescent carboxylate-modified NMs (FluoSpheres™) (red) for 2 h, fixed and counterstained with phalloidin (green) and DAPI (blue) for visualization of cell nuclei and cytoplasmic actin respectively. Confocal Z-stacks were acquired, and orthogonal (XZ and YZ) projections used to confirm the internalization of particles by cells, highlighted by white arrows. Images shown are representative. Scale bar = 10 µm.